
Win Probability Added – Batsman Review
Want to share your content on R-bloggers? click here if you have a blog, or here if you don't.
Hello readers and welcome to the batsman review of my win probability added metric review. In the first part, linked here:
https://theparttimeanalyst.com/2020/06/20/twenty20-win-probability-added/
I created the metric using a logistic regression machine learning model. Now its time to apply the model to real data and look at what insights it can show.
The first question I want to ask which performance in the data I have had the biggest impact on a teams chances of winning.

There we see the top 10 performances for batsmen for win probability added. As we can see the universe boss Chris Gayle appears 3 times in the top 10 with the best performance ever being his 151 off 62 balls in the blast against Kent.
Chris Gayle has always opened the batting which leads me to wonder if does the where batsman bat effect how much win probability they add.

When in an innings a batsman faces there first ball is a proxy for where the batsman was batting in order. As you can see with the graph above the win probability added is quite similar for any innings up to just after the half point. After that on average innings starting then have had negative impacts on the teams chances of winning. This tells me that either the best players are opening the batting or batting earlier is easier to strike at high rates and score more runs. I guess like anything its probably a mixture of the two.

For the final part of the overall analysis I looked at how a Batsman WPA is effected by the competition. A net positive means the competition is easier as a player is generally adding more then there career average and a negative means the player is adding less. I found it quite surprising the Caribbean premier league as the most difficult for batsman. Looks like a lot of batsman went there and struggled.
This years blast finished in October with the Notts Outlaws taking the trophy for the second time. For this win probability metric I think I will normalise it to win probability added for every 10 balls faced for the batsman.
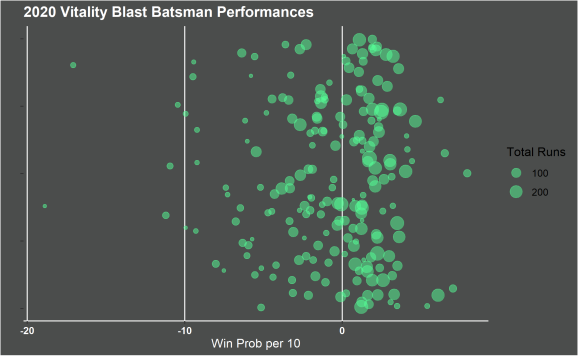
As we can see most of the performances in this years blast were around 0 for the batsman but there are the clear players who regularly had positive contributions to there teams outcomes. There are also a lot of players with negative outcomes as well.

Next we can see that win probability added is highly correlated with the batsman’s strike rate. This suggests that as a general rule the higher strike rate player might be better even if another player scores more runs generally.
I have looked at some of the big picture areas like how batting position effects the number now I want to move on and look at player performances over the years and the first player I want to look at is Jos Butler.

He seems to be in general improving as the years have gone on. In his early years he was facing less balls and not contributing as much as he is now. This could be because he was starting his innings much later in the teams innings.

When you look at Butlers batting position over the span of his career you can clearly see he changes from coming in on average around halfway and not really contributing lower WPA to coming in earlier which coincides with his increase in WPA.
Thanks for reading.
R-bloggers.com offers daily e-mail updates about R news and tutorials about learning R and many other topics. Click here if you're looking to post or find an R/data-science job.
Want to share your content on R-bloggers? click here if you have a blog, or here if you don't.