
Coronavirus data analysis with R, tidyverse and ggplot2
[This article was first published on R – blog.RDataMining.com, and kindly contributed to R-bloggers]. (You can report issue about the content on this page here)
Want to share your content on R-bloggers? click here if you have a blog, or here if you don't.
Want to share your content on R-bloggers? click here if you have a blog, or here if you don't.
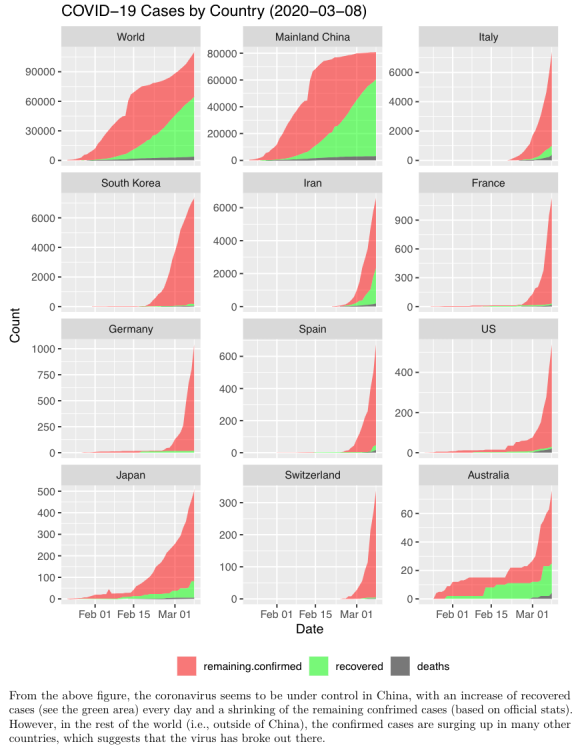
Coronavirus data analysis – an analysis of data around the Novel Coronavirus (COVID-19) with R, tidyverse and ggplot2. Download full analysis reports at links below.
Coronavirus data analysis – world wide
http://www.rdatamining.com/docs/Coronavirus-data-analysis-world.pdf
Coronavirus data analysis – China
http://www.rdatamining.com/docs/Coronavirus-data-analysis-china.pdf

To leave a comment for the author, please follow the link and comment on their blog: R – blog.RDataMining.com.
R-bloggers.com offers daily e-mail updates about R news and tutorials about learning R and many other topics. Click here if you're looking to post or find an R/data-science job.
Want to share your content on R-bloggers? click here if you have a blog, or here if you don't.