
fuzzySim updated to 3.0 on CRAN!
Want to share your content on R-bloggers? click here if you have a blog, or here if you don't.
The newest version of R package fuzzySim (3.0) is now on CRAN! It includes new functions such as ‘favClass‘, ‘bioThreat‘ and ‘gridRecords‘; improvements to some functions, help files and examples; updated e-mail and citation information [ see citation(“fuzzySim”) ]; clarifications and typo corrections along the reference manual; and some bug fixes (after changes to base R and/or to function dependencies), e.g. to ‘getPreds‘ when applied to raster objects. You should now uninstall the old version of the package and install the new one:
remove.packages("fuzzysim")
install.packages("fuzzysim")
Among other new functionalities, fuzzySim now makes it easier to use variable selection and presence-absence modelling techniques on occurrence points + raster variables, as these are becoming the more common data formats in species distribution modelling (SDM) and ecological niche modelling (ENM). Here’s a worked example:
# download and plot predictor variables:
library(dismo)
worldclim <- getData("worldclim", var = "bio", res = 10)
plot(worldclim)
plot(worldclim[[1]])

# download and plot species occurrence data:
library(rgbif)
gbif <- occ_data(scientificName = "Galemys pyrenaicus", hasCoordinate = TRUE, limit = 5000)
absence_rows <- which(gbif$data$occurrenceStatus == "absent" | gbif$data$organismQuantity == 0)
if (length(absence_rows) > 0) gbif$data <- gbif$data[-absence_rows, ]
presences <- gbif$data[ , c("decimalLongitude", "decimalLatitude")]
points(presences)

# crop variables to extent of presence data:
worldclim_crop <- crop(worldclim, extent(range(presences$decimalLongitude), range(presences$decimalLatitude)))
plot(worldclim_crop[[1]])
points(presences)

# model occurrence data as presence-absence in the cropped grid of pixels:
library(fuzzySim)
# first, get the centroid coordinates and variable values
# at pixels with and without presence records:
gridded_presences <- gridRecords(rst = worldclim_crop, pres.coords = presences)
head(gridded_presences)
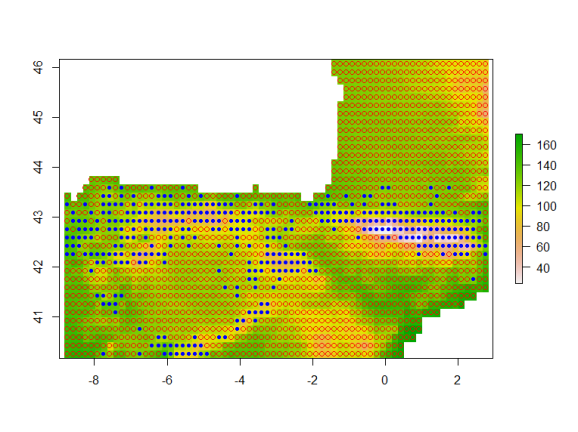
plot(worldclim_crop[[1]])
points(gridded_presences[gridded_presences$presence == 0, c("x", "y")], col = "red")
points(gridded_presences[gridded_presences$presence == 1, c("x", "y")], col = "blue", pch = 20)
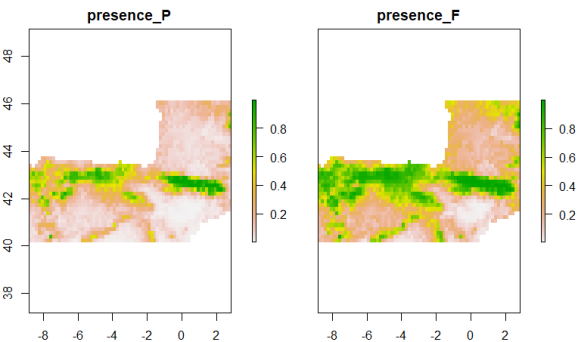
# then, build a GLM with variable selection on these presence-absence data:
names(gridded_presences)
model_GLM <- multGLM(data = gridded_presences, sp.cols = "presence", var.cols = 5:23, id.col = "cells", FDR = TRUE, corSelect = TRUE, step = TRUE, trim = TRUE)
summary(model_GLM$models$presence)
head(model_GLM$predictions)

# finally, get and plot the model predictions (probability and favourability):
pred_GLM_raster <- getPreds(data = stack(worldclim_crop), models = model_GLM$models)
plot(pred_GLM_raster)
In case you’re worried about using a presence-absence modelling method on presence-only records, you can compare these predictions with those of a widely used presence-background modelling method (Maxent) on the same data, to check that they are not far off:
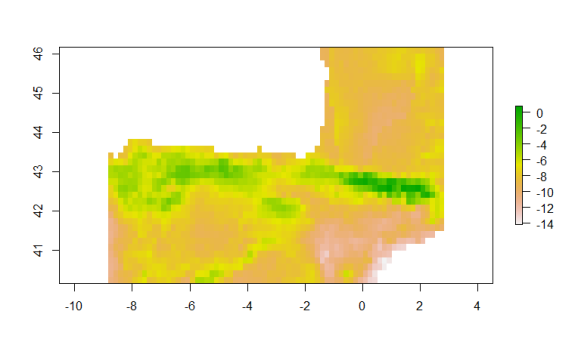
library(maxnet)
model_maxent <- maxnet(p = gridded_presences[ , "presence"], data = gridded_presences[ , 5:23], f = maxnet.formula(p = gridded_presences[ , "presence"], data = gridded_presences[ , 5:23], classes = "lq"))  # linear + quadratic features
pred_maxent_raster <- raster::predict(worldclim_crop, model_maxent)
plot(pred_maxent_raster)
This and other modelling methods will be taught next week at the CIBIO advanced course on ecological niche modelling. Check out the Training page for more upcoming courses!
R-bloggers.com offers daily e-mail updates about R news and tutorials about learning R and many other topics. Click here if you're looking to post or find an R/data-science job.
Want to share your content on R-bloggers? click here if you have a blog, or here if you don't.