
Plotting Pairs (GC4W6HJ)
Want to share your content on R-bloggers? click here if you have a blog, or here if you don't.
Planning for a trip to Cornwall, I was churning through some mysteries there, largely picking them at random from the map. I worked my way through this one by hand, copying the puzzle into a text editor and separating the pairs manually before finally transferring it into RStudio and plotting the result. I moved on.
Later, I twigged that this would be an ideal demonstration of several powerful aspects of string manipulation in R, so I returned and wrote a program to do the same.
The puzzle is straightforward: just plot the coordinate pairs and you should see the cache coordinates spelled out in your plot.
I chose to use a regular expression to extract the contents of each pair of parentheses, using the str_extract_all function from the stringr package. This “regex” approach is powerful but also makes for a daunting read. If you are new to regular expressions, this website can help you understand them a little better. There is also a cheatsheet section to help remind more experienced users. Regular expressions are definitely worth the trouble.
library(tidyverse)
library(magrittr)
library(stringr)
B10 <- "(-3,-1)(-3,-5)(-2,-3)(-1,-5)(-1,-1) (-8,9)(-10,9)(-10,7)(-9,7)(-8,5)(-10,5) (-7,5)(-7,9)(-5,9)(-5,5)(-7,5) (-5,-6)(-6,-8)(-6,-10)(-4,-10)(-4,-8)(-6,-8) (2,9)(1,7)(1,5)(3,5)(3,7)(1,7) (5,-8)(3,-8)(3,-10)(5,-10)(5,-6)(4,-6)(4,-8) (2,-1)(0,-1)(0,-3)(1,-3)(2,-5)(0,-5) (2,-6)(0,-6)(0,-8)(1,-8)(2,-10)(0,-10) (-13,5)(-13,9)(-11,5)(-11,9) (12,7)(10,7)(10,5)(12,5)(12,9)(11,9)(11,7) (-1,-8)(-3,-8)(-3,-6)(-1,-6)(-1,-8)(-2,-10) (8,9)(7,7)(7,5)(9,5)(9,7)(7,7) (4,5)(4,9)(6,9)(6,5)(4,5) (-2,8)(-1,9)(-1,5)"

B10 %>%
  str_extract_all("(?<=\()([^\(\)]+)(?=\))") %>%
  unlist() %>%
  paste(collapse=",") %>%
  str_split(",") %>%
  unlist() %>%
  as.numeric() %>%
  matrix(ncol = 2, byrow = TRUE) %>%
  plot(type="l")
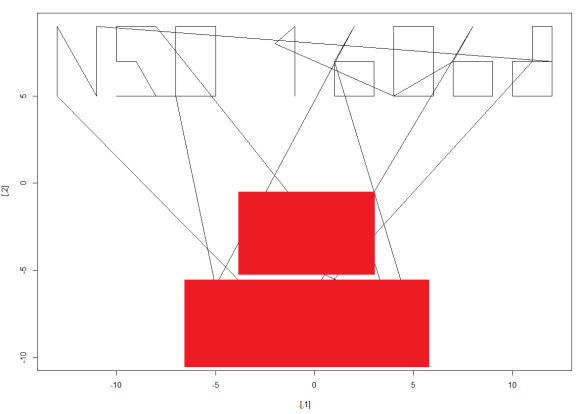
I chose to collapse the pairs of numbers into one big vector and make them into a matrix, which I then plotted with a line plot. It’s not tidy because of the lines joining different characters, but it’s legible.
I just noticed that there are spaces in the original text, probably to separate individual characters. Therefore I could have made something even more sophisticated, separating by spaces first and producing a tidier plot. But I’ve solved this puzzle twice now; a third time just for perfection would be overkill.
The bulk of the work in this puzzle is preparing the data, which is similar to many data visualisation or analysis workflows. stringr is the main engine of my solution, plucking the pairs from the parentheses, and again splitting them by the separator in order to coerce messy character data into a clean set of numbers that can be plotted. And it’s scalable, unlike the by-hand method I first used. This task involved 156 numbers, but it could just as easily have been 1560, making the manual approach a poor use of solving time.
R-bloggers.com offers daily e-mail updates about R news and tutorials about learning R and many other topics. Click here if you're looking to post or find an R/data-science job.
Want to share your content on R-bloggers? click here if you have a blog, or here if you don't.