
Causal inference with DAGs in R
Want to share your content on R-bloggers? click here if you have a blog, or here if you don't.
Directed cyclical graphs (DAGs) are a powerful tool to understand and deal with causal inference. The book “Causal inference in statistics: a primer” is a useful reference to start, authored from Pearl, Glymour, and Jewell. Directed cyclical graphs (DAGs) are a powerful tool to understand and deal with causal inference. Causal inference in statistics: a primer” is a good resource from
A DAG is a directed acyclic graph, a visual encoding of a joint distribution of a set of variables. In a DAG all the variables are depicted as vertices and connected by arrows or directed paths, sequences of arrows in which every arrow points to some direction. DAGs are acyclic because no directed path can form a closed loop.
The dagitty package is an effective tool for drawing and analyzing DAGs. Available functions include identification of minimal sufficient adjustment sets for estimating causal effects.
Let’s now focus on the following example. We are interesting in draw causal inference of the treatment (T) effect on a certain outcome (Y). The analysis can be biased due to the presence of several confounders (X1, X2, X3).
Let’s presume some relationships and code them with dagitty functions.
library(dagitty)
dag <- dagitty("dag {
X1 -> X2
X1 -> Y
X3 -> X2
X2 -> Y
X2 -> T -> Y
X3 -> T
}")
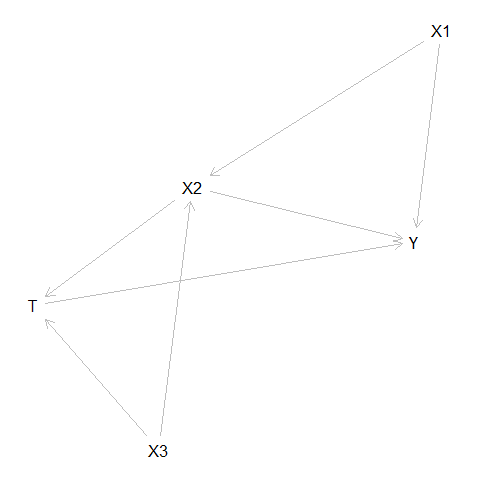
plot( graphLayout( dag ) )
X3 is a parent of X2 and T, X2 is an ancestor of Y, Y is a child of X2 and Y is a descendant of X2.
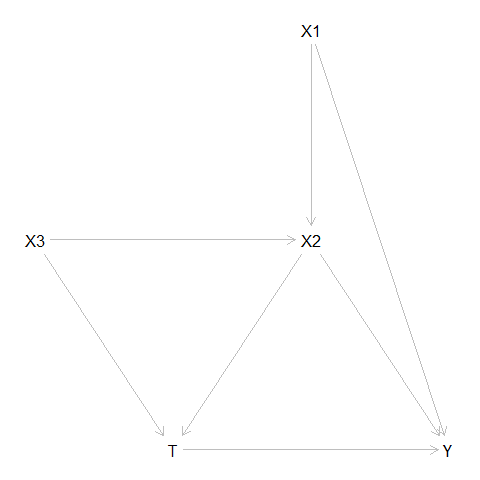
Let’s now make things clearer providing relative coordinates.
coordinates( dag ) <-  list(
  x=c(X1=3, X2=3, X3=1, T=2, Y=4),
  y=c(X1=1, X2=2, X3=2, T=3, Y=3) )
plot( dag )
We can now ask with a function if we are adjusting with the correct set of variables.
exposures(dag) <- c("T")
outcomes(dag) <- c("Y")
isAdjustmentSet( dag, c("X2") )
[1] FALSE
isAdjustmentSet( dag, c("X1") )
[1] FALSE
isAdjustmentSet( dag, c("X2", "X1") )
[1] TRUE
In order to draw unbiased causal inference we could adjust or match on both X1 and X2. Adjusting only for X1 or X2 will not remove the potential source of bias. Adjusting for X1, X2 and X3 is not required.
We can do the same with ggdag.
library(ggdag)
tidy_dag <- tidy_dagitty(dag)
ggdag(tidy_dag) +
  theme_dag()
We can now ask for the children or parents of some variables.
ggdag_parents(tidy_ggdag, "T", text_col = "black")
ggdag_children(tidy_ggdag, "T", text_col = "black")
But most importantly we can ask what are the minmal adjustment sets
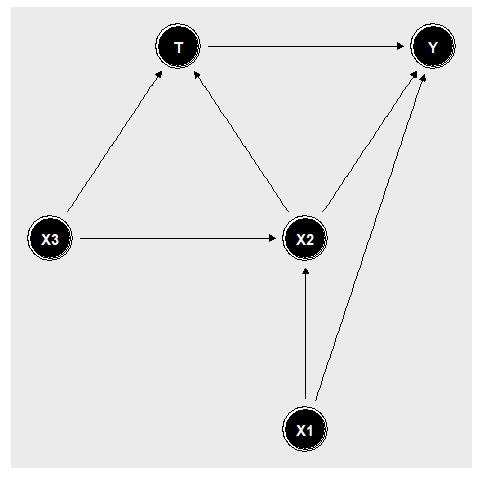
ggdag_adjustment_set(tidy_ggdag, node_size = 14, text_col = "black") +
  theme(legend.position = "bottom")
And we have two suggestions from ggdag: X1 and X2 or X2 and X3.

R-bloggers.com offers daily e-mail updates about R news and tutorials about learning R and many other topics. Click here if you're looking to post or find an R/data-science job.
Want to share your content on R-bloggers? click here if you have a blog, or here if you don't.