
Big Data-4: Webserver log analysis with RDDs, Pyspark, SparkR and SparklyR
Want to share your content on R-bloggers? click here if you have a blog, or here if you don't.
“There’s something so paradoxical about pi. On the one hand, it represents order, as embodied by the shape of a circle, long held to be a symbol of perfection and eternity. On the other hand, pi is unruly, disheveled in appearance, its digits obeying no obvious rule, or at least none that we can perceive. Pi is elusive and mysterious, forever beyond reach. Its mix of order and disorder is what makes it so bewitching. ”
From Infinite Powers by Steven Strogatz
Anybody who wants to be “anybody” in Big Data must necessarily be able to work on both large structured and unstructured data. Log analysis is critical in any enterprise which is usually unstructured. As I mentioned in my previous post Big Data: On RDDs, Dataframes,Hive QL with Pyspark and SparkR-Part 3 RDDs are typically used to handle unstructured data. Spark has the Dataframe abstraction over RDDs which performs better as it is optimized with the Catalyst optimization engine. Nevertheless, it is important to be able to process with RDDs. This post is a continuation of my 3 earlier posts on Big Data namely
1. Big Data-1: Move into the big league:Graduate from Python to Pyspark
2. Big Data-2: Move into the big league:Graduate from R to SparkR
3. Big Data: On RDDs, Dataframes,Hive QL with Pyspark and SparkR-Part 3
This post uses publicly available Webserver logs from NASA. The logs are for the months Jul 95 and Aug 95 and are a good place to start unstructured text analysis/log analysis. I highly recommend parsing these publicly available logs with regular expressions. It is only when you do that the truth of Jamie Zawinski’s pearl of wisdom
“Some people, when confronted with a problem, think “I know, I’ll use regular expressions.” Now they have two problems.” – Jamie Zawinksi
hits home. I spent many hours struggling with regex!!
For this post for the RDD part, I had to refer to Dr. Fisseha Berhane’s blog post Webserver Log Analysis and for the Pyspark part, to the Univ. of California Specialization which I had done 3 years back Big Data Analysis with Apache Spark. Once I had played around with the regex for RDDs and PySpark I managed to get SparkR and SparklyR versions to work.
The notebooks used in this post have been published and are available at
You can also download all the notebooks from Github at WebServerLogsAnalysis
An essential and unavoidable aspect of Big Data processing is the need to process unstructured text.Web server logs are one such area which requires Big Data techniques to process massive amounts of logs. The Common Log Format also known as the NCSA Common log format, is a standardized text file format used by web servers when generating server log files. Because the format is standardized, the files can be readily analyzed.
A publicly available webserver logs is the NASA-HTTP Web server logs. This is good dataset with which we can play around to get familiar to handling web server logs. The logs can be accessed at NASA-HTTP
Description These two traces contain two month’s worth of all HTTP requests to the NASA Kennedy Space Center WWW server in Florida.
Format The logs are an ASCII file with one line per request, with the following columns:
-host making the request. A hostname when possible, otherwise the Internet address if the name could not be looked up.
-timestamp in the format “DAY MON DD HH:MM:SS YYYY”, where DAY is the day of the week, MON is the name of the month, DD is the day of the month, HH:MM:SS is the time of day using a 24-hour clock, and YYYY is the year. The timezone is -0400.
-request given in quotes.
-HTTP reply code.
-bytes in the reply.
1 Parse Web server logs with RDDs
1.2Check content
for line in rdd.sample(withReplacement = False, fraction = 0.00001, seed = 100).collect():
i=i+1
print(line)
if i >5:
break
slip183-1.kw.jp.ibm.net – – [04/Aug/1995:18:42:17 -0400] “GET /shuttle/missions/sts-70/images/DSC-95EC-0001.gif HTTP/1.0” 200 107133
piweba4y.prodigy.com – – [05/Aug/1995:19:17:41 -0400] “GET /icons/menu.xbm HTTP/1.0” 200 527
ruperts.bt-sys.bt.co.uk – – [07/Aug/1995:04:44:10 -0400] “GET /shuttle/countdown/video/livevideo2.gif HTTP/1.0” 200 69067
dal06-04.ppp.iadfw.net – – [07/Aug/1995:21:10:19 -0400] “GET /images/NASA-logosmall.gif HTTP/1.0” 200 786
p15.ppp-1.directnet.com – – [10/Aug/1995:01:22:54 -0400] “GET /images/KSC-logosmall.gif HTTP/1.0” 200 1204
1.21 Get IP address/host name
rslt=(rdd.map(lambda line: re.search('\S+',line)
.group(0))
.take(3)) # Get the IP address \host name
rslt
.groups())
.take(3)) #Get the date
rslt
(‘[01/Aug/1995:00:00:07 -0400’,),
(‘[01/Aug/1995:00:00:08 -0400’,)]
1.23 HTTP request
rslt=(rdd.map(lambda line: re.search('"\w+\s+([^\s]+)\s+HTTP.*"',line)
.groups())
.take(3)) # Get the REST call
rslt
(‘/’,),
(‘/images/ksclogo-medium.gif’,)]
rslt=(rdd.map(lambda line: re.search('"\s(\d{3})',line)
.groups())
.take(3)) #Get the status
rslt
.groups())
.take(3)) # Get the content size
rslt
rslt=(rdd.map(lambda line: re.search('^(\S+)((\s)(-))+\s(\[\S+ -\d{4}\])\s("\w+\s+([^\s]+)\s+HTTP.*")\s(\d{3}\s(\d*)$)',line)
.groups())
.take(3))
rslt
‘ -‘,
‘ ‘,
‘-‘,
‘[01/Aug/1995:00:00:01 -0400]’,
‘”GET /shuttle/missions/sts-68/news/sts-68-mcc-05.txt HTTP/1.0″‘,
‘/shuttle/missions/sts-68/news/sts-68-mcc-05.txt’,
‘200 1839’,
‘1839’),
(‘uplherc.upl.com’,
‘ -‘,
‘ ‘,
‘-‘,
‘[01/Aug/1995:00:00:07 -0400]’,
‘”GET / HTTP/1.0″‘,
‘/’,
‘304 0’,
‘0’),
(‘uplherc.upl.com’,
‘ -‘,
‘ ‘,
‘-‘,
‘[01/Aug/1995:00:00:08 -0400]’,
‘”GET /images/ksclogo-medium.gif HTTP/1.0″‘,
‘/images/ksclogo-medium.gif’,
‘304 0’,
‘0’)]
1.25 Add a log parsing function
def parse_log1(line):
match = re.search('^(\S+)((\s)(-))+\s(\[\S+ -\d{4}\])\s("\w+\s+([^\s]+)\s+HTTP.*")\s(\d{3}\s(\d*)$)',line)
if match is None:
return(line,0)
else:
return(line,1)
1.26 Check for parsing failure
n_logs = rdd.count()
failed = rdd.map(lambda line: parse_log1(line)).filter(lambda line: line[1] == 0).count()
print('Out of a total of {} logs, {} failed to parse'.format(n_logs,failed))
# Get the failed records line[1] == 0
failed1=rdd.map(lambda line: parse_log1(line)).filter(lambda line: line[1]==0)
failed1.take(3)
Out[10]:
[(‘gw1.att.com – – [01/Aug/1995:00:03:53 -0400] “GET /shuttle/missions/sts-73/news HTTP/1.0” 302 -‘,
0),
(‘js002.cc.utsunomiya-u.ac.jp – – [01/Aug/1995:00:07:33 -0400] “GET /shuttle/resources/orbiters/discovery.gif HTTP/1.0” 404 -‘,
0),
(‘pipe1.nyc.pipeline.com – – [01/Aug/1995:00:12:37 -0400] “GET /history/apollo/apollo-13/apollo-13-patch-small.gif” 200 12859’,
0)]
1.26 The above rule is not enough to parse the logs
File “/databricks/spark/python/pyspark/util.py”, line 99, in wrapper
return f(*args, **kwargs)
File “
AttributeError: ‘NoneType’ object has no attribute ‘group’
at org.apache.spark.api.python.BasePythonRunner$ReaderIterator.handlePythonException(PythonRunner.scala:490)
def parse_failed(line):
match = re.search('^(\S+)((\s)(-))+\s(\[\S+ -\d{4}\])\s("\w+\s+([^\s]+)\s+HTTP.*")\s(\d{3}\s-$)',line)
if match is None:
return(line,0)
else:
return(line,1)
failed2.take(5)
[(‘gw1.att.com – – [01/Aug/1995:00:03:53 -0400] “GET /shuttle/missions/sts-73/news HTTP/1.0” 302 -‘,
1),
(‘js002.cc.utsunomiya-u.ac.jp – – [01/Aug/1995:00:07:33 -0400] “GET /shuttle/resources/orbiters/discovery.gif HTTP/1.0” 404 -‘,
1),
(‘tia1.eskimo.com – – [01/Aug/1995:00:28:41 -0400] “GET /pub/winvn/release.txt HTTP/1.0” 404 -‘,
1),
(‘itws.info.eng.niigata-u.ac.jp – – [01/Aug/1995:00:38:01 -0400] “GET /ksc.html/facts/about_ksc.html HTTP/1.0” 403 -‘,
1),
(‘grimnet23.idirect.com – – [01/Aug/1995:00:50:12 -0400] “GET /www/software/winvn/winvn.html HTTP/1.0” 404 -‘,
1)]
1.28 Add both rules
def parse_log2(line):
# Parse logs with the rule below
match = re.search('^(\S+)((\s)(-))+\s(\[\S+ -\d{4}\])\s("\w+\s+([^\s]+)\s+HTTP.*")\s(\d{3})\s(\d*)$',line)
# If match failed then use the rule below
if match is None:
match = re.search('^(\S+)((\s)(-))+\s(\[\S+ -\d{4}\])\s("\w+\s+([^\s]+)\s+HTTP.*")\s(\d{3}\s-$)',line)
if match is None:
return (line, 0) # Return 0 for failure
else:
return (line, 1) # Return 1 for success
1.29 Group the different regex to groups for handling
match = re.search('^(\S+)((\s)(-))+\s(\[\S+ -\d{4}\])\s("\w+\s+([^\s]+)\s+HTTP.*")\s(\d{3})\s(\d*)$',line)
if match is None:
match = re.search('^(\S+)((\s)(-))+\s(\[\S+ -\d{4}\])\s("\w+\s+([^\s]+)\s+HTTP.*")\s(\d{3})\s(-)$',line)
return(match.groups())
1.30 Parse the logs and map the groups
parsed_rdd2 = parsed_rdd.map(lambda line: map2groups(line))
2. Parse Web server logs with Pyspark
logs_file_path="/FileStore/tables/" + os.path.join('NASA_access_log_*.gz')
from pyspark.sql.functions import split, regexp_extract
base_df = sqlContext.read.text(logs_file_path)
#base_df.show(truncate=False)
from pyspark.sql.functions import split, regexp_extract
split_df = base_df.select(regexp_extract('value', r'^([^\s]+\s)', 1).alias('host'),
regexp_extract('value', r'^.*\[(\d\d\/\w{3}\/\d{4}:\d{2}:\d{2}:\d{2} -\d{4})]', 1).alias('timestamp'),
regexp_extract('value', r'^.*"\w+\s+([^\s]+)\s+HTTP.*"', 1).alias('path'),
regexp_extract('value', r'^.*"\s+([^\s]+)', 1).cast('integer').alias('status'),
regexp_extract('value', r'^.*\s+(\d+)$', 1).cast('integer').alias('content_size'))
split_df.show(5,truncate=False)
|host |timestamp |path |status|content_size|
+———————+————————–+———————————————–+——+————+
|199.72.81.55 |01/Jul/1995:00:00:01 -0400|/history/apollo/ |200 |6245 |
|unicomp6.unicomp.net |01/Jul/1995:00:00:06 -0400|/shuttle/countdown/ |200 |3985 |
|199.120.110.21 |01/Jul/1995:00:00:09 -0400|/shuttle/missions/sts-73/mission-sts-73.html |200 |4085 |
|burger.letters.com |01/Jul/1995:00:00:11 -0400|/shuttle/countdown/liftoff.html |304 |0 |
|199.120.110.21 |01/Jul/1995:00:00:11 -0400|/shuttle/missions/sts-73/sts-73-patch-small.gif|200 |4179 |
+———————+————————–+———————————————–+——+————+
only showing top 5 rows
split_df['timestamp'].isNull() |
split_df['path'].isNull() |
split_df['status'].isNull() |
split_df['content_size'].isNull())
bad_rows_df.count()
2.3Check no of rows which do not have digits
bad_content_size_df.count()
2.4 Add ‘*’ to identify bad rows
bad_content_size_df.select(concat(bad_content_size_df['value'], lit('*'))).show(4,truncate=False)
|concat(value, *) |
+—————————————————————————————————————————————————+
|dd15-062.compuserve.com – – [01/Jul/1995:00:01:12 -0400] “GET /news/sci.space.shuttle/archive/sci-space-shuttle-22-apr-1995-40.txt HTTP/1.0” 404 -*|
|dynip42.efn.org – – [01/Jul/1995:00:02:14 -0400] “GET /software HTTP/1.0” 302 -* |
|ix-or10-06.ix.netcom.com – – [01/Jul/1995:00:02:40 -0400] “GET /software/winvn HTTP/1.0” 302 -* |
|ix-or10-06.ix.netcom.com – – [01/Jul/1995:00:03:24 -0400] “GET /software HTTP/1.0” 302 -* |
+—————————————————————————————————————————————————+
2.5 Fill NAs with 0s
cleaned_df = split_df.na.fill({‘content_size’: 0})
3. Webserver logs parsing with SparkR
library(stringr)
file_location = "/FileStore/tables/NASA_access_log_Jul95.gz"
file_location = "/FileStore/tables/NASA_access_log_Aug95.gz"
# Load the SparkR library
# Initiate a SparkR session
sparkR.session()
sc <- sparkR.session()
sqlContext <- sparkRSQL.init(sc)
df <- read.text(sqlContext,"/FileStore/tables/NASA_access_log_Jul95.gz")
#df=SparkR::select(df, "value")
#head(SparkR::collect(df))
#m=regexp_extract(df$value,'\\\\S+',1)
a=df %>%
withColumn('host', regexp_extract(df$value, '^(\\S+)', 1)) %>%
withColumn('timestamp', regexp_extract(df$value, "((\\S+ -\\d{4}))", 2)) %>%
withColumn('path', regexp_extract(df$value, '(\\"\\w+\\s+([^\\s]+)\\s+HTTP.*")', 2)) %>%
withColumn('status', regexp_extract(df$value, '(^.*"\\s+([^\\s]+))', 2)) %>%
withColumn('content_size', regexp_extract(df$value, '(^.*\\s+(\\d+)$)', 2))
#b=a%>% select(host,timestamp,path,status,content_type)
head(SparkR::collect(a),10)
1 199.72.81.55 – – [01/Jul/1995:00:00:01 -0400] “GET /history/apollo/ HTTP/1.0” 200 6245
2 unicomp6.unicomp.net – – [01/Jul/1995:00:00:06 -0400] “GET /shuttle/countdown/ HTTP/1.0” 200 3985
3 199.120.110.21 – – [01/Jul/1995:00:00:09 -0400] “GET /shuttle/missions/sts-73/mission-sts-73.html HTTP/1.0” 200 4085
4 burger.letters.com – – [01/Jul/1995:00:00:11 -0400] “GET /shuttle/countdown/liftoff.html HTTP/1.0” 304 0
5 199.120.110.21 – – [01/Jul/1995:00:00:11 -0400] “GET /shuttle/missions/sts-73/sts-73-patch-small.gif HTTP/1.0” 200 4179
6 burger.letters.com – – [01/Jul/1995:00:00:12 -0400] “GET /images/NASA-logosmall.gif HTTP/1.0” 304 0
7 burger.letters.com – – [01/Jul/1995:00:00:12 -0400] “GET /shuttle/countdown/video/livevideo.gif HTTP/1.0” 200 0
8 205.212.115.106 – – [01/Jul/1995:00:00:12 -0400] “GET /shuttle/countdown/countdown.html HTTP/1.0” 200 3985
9 d104.aa.net – – [01/Jul/1995:00:00:13 -0400] “GET /shuttle/countdown/ HTTP/1.0” 200 3985
10 129.94.144.152 – – [01/Jul/1995:00:00:13 -0400] “GET / HTTP/1.0” 200 7074
host timestamp
1 199.72.81.55 [01/Jul/1995:00:00:01 -0400
2 unicomp6.unicomp.net [01/Jul/1995:00:00:06 -0400
3 199.120.110.21 [01/Jul/1995:00:00:09 -0400
4 burger.letters.com [01/Jul/1995:00:00:11 -0400
5 199.120.110.21 [01/Jul/1995:00:00:11 -0400
6 burger.letters.com [01/Jul/1995:00:00:12 -0400
7 burger.letters.com [01/Jul/1995:00:00:12 -0400
8 205.212.115.106 [01/Jul/1995:00:00:12 -0400
9 d104.aa.net [01/Jul/1995:00:00:13 -0400
10 129.94.144.152 [01/Jul/1995:00:00:13 -0400
path status content_size
1 /history/apollo/ 200 6245
2 /shuttle/countdown/ 200 3985
3 /shuttle/missions/sts-73/mission-sts-73.html 200 4085
4 /shuttle/countdown/liftoff.html 304 0
5 /shuttle/missions/sts-73/sts-73-patch-small.gif 200 4179
6 /images/NASA-logosmall.gif 304 0
7 /shuttle/countdown/video/livevideo.gif 200 0
8 /shuttle/countdown/countdown.html 200 3985
9 /shuttle/countdown/ 200 3985
10 / 200 7074
4 Webserver logs parsing with SparklyR
install.packages("sparklyr")
library(sparklyr)
library(dplyr)
library(stringr)
#sc <- spark_connect(master = "local", version = "2.1.0")
sc <- spark_connect(method = "databricks")
sdf <-spark_read_text(sc, name="df", path = "/FileStore/tables/NASA_access_log*.gz")
sdf
# Source: spark [?? x 1]
line
1 "199.72.81.55 - - [01/Jul/1995:00:00:01 -0400] \"GET /history/apollo/ HTTP/1…
2 "unicomp6.unicomp.net - - [01/Jul/1995:00:00:06 -0400] \"GET /shuttle/countd…
3 "199.120.110.21 - - [01/Jul/1995:00:00:09 -0400] \"GET /shuttle/missions/sts…
4 "burger.letters.com - - [01/Jul/1995:00:00:11 -0400] \"GET /shuttle/countdow…
5 "199.120.110.21 - - [01/Jul/1995:00:00:11 -0400] \"GET /shuttle/missions/sts…
6 "burger.letters.com - - [01/Jul/1995:00:00:12 -0400] \"GET /images/NASA-logo…
7 "burger.letters.com - - [01/Jul/1995:00:00:12 -0400] \"GET /shuttle/countdow…
8 "205.212.115.106 - - [01/Jul/1995:00:00:12 -0400] \"GET /shuttle/countdown/c…
9 "d104.aa.net - - [01/Jul/1995:00:00:13 -0400] \"GET /shuttle/countdown/ HTTP…
10 "129.94.144.152 - - [01/Jul/1995:00:00:13 -0400] \"GET / HTTP/1.0\" 200 7074"
# … with more rows
library(sparklyr)
library(dplyr)
library(stringr)
#sc <- spark_connect(master = "local", version = "2.1.0")
sc <- spark_connect(method = "databricks")
sdf <-spark_read_text(sc, name="df", path = "/FileStore/tables/NASA_access_log*.gz")
sdf <- sdf %>% mutate(host = regexp_extract(line, '^(\\\\S+)',1)) %>%
mutate(timestamp = regexp_extract(line, '((\\\\S+ -\\\\d{4}))',2)) %>%
mutate(path = regexp_extract(line, '(\\\\"\\\\w+\\\\s+([^\\\\s]+)\\\\s+HTTP.*")',2)) %>%
mutate(status = regexp_extract(line, '(^.*"\\\\s+([^\\\\s]+))',2)) %>%
mutate(content_size = regexp_extract(line, '(^.*\\\\s+(\\\\d+)$)',2))
5 Hosts
5.1 RDD
parsed_rdd2 = parsed_rdd.map(lambda line: map2groups(line))
# Create tuples of (host,1) and apply reduceByKey() and order by descending
rslt=(parsed_rdd2.map(lambda xx[0],1))
.reduceByKey(lambda a,b:a+b)
.takeOrdered(10, lambda x: -x[1]))
rslt
[(‘piweba3y.prodigy.com’, 21988),
(‘piweba4y.prodigy.com’, 16437),
(‘piweba1y.prodigy.com’, 12825),
(‘edams.ksc.nasa.gov’, 11962),
(‘163.206.89.4’, 9697),
(‘news.ti.com’, 8161),
(‘www-d1.proxy.aol.com’, 8047),
(‘alyssa.prodigy.com’, 8037),
(‘siltb10.orl.mmc.com’, 7573),
(‘www-a2.proxy.aol.com’, 7516)]
5.12Plot counts of hosts
import pandas as pd import matplotlib.pyplot as plt df=pd.DataFrame(rslt,columns=[‘host’,‘count’]) sns.barplot(x=‘host’,y=‘count’,data=df) plt.subplots_adjust(bottom=0.6, right=0.8, top=0.9) plt.xticks(rotation=“vertical”,fontsize=8) display()

5.2 PySpark
.groupBy('host')
.count()
.orderBy('count',ascending=False))
df.show(5)
| host|count|
+——————–+—–+
|piweba3y.prodigy….|21988|
|piweba4y.prodigy….|16437|
|piweba1y.prodigy….|12825|
| edams.ksc.nasa.gov |11964|
| 163.206.89.4 | 9697|
+——————–+—–+
only showing top 5 rows
5.22 Plot count of hosts
import pandas as pd
import seaborn as sns
df1=df.toPandas()
df2 = df1.head(10)
df2.count()
sns.barplot(x='host',y='count',data=df2)
plt.subplots_adjust(bottom=0.5, right=0.8, top=0.9)
plt.xlabel("Hosts")
plt.ylabel('Count')
plt.xticks(rotation="vertical",fontsize=10)
display()

5.3 SparkR
df=SparkR::summarize(SparkR::groupBy(c, a$host), noHosts = count(a$host)) df1 =head(arrange(df,desc(df$noHosts)),10) head(df1)
1 piweba3y.prodigy.com 17572 2 piweba4y.prodigy.com 11591 3 piweba1y.prodigy.com 9868 4 alyssa.prodigy.com 7852 5 siltb10.orl.mmc.com 7573 6 piweba2y.prodigy.com 5922
5.32 Plot count of hosts
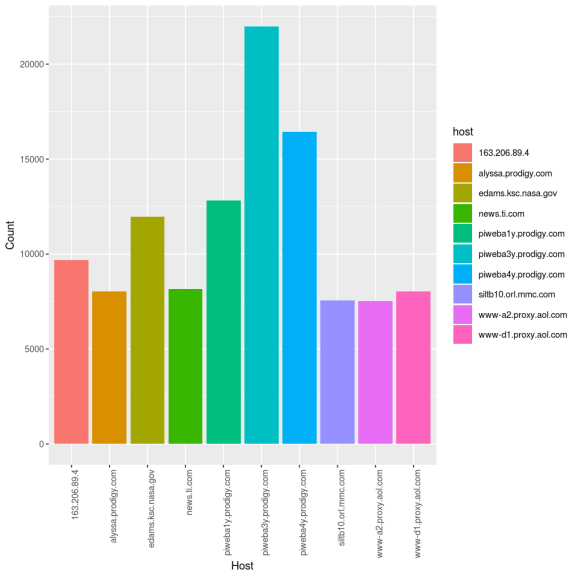
p <-ggplot(data=df1, aes(x=host, y=noHosts,fill=host)) + geom_bar(stat="identity") + theme(axis.text.x = element_text(angle = 90, hjust = 1)) + xlab('Host') + ylab('Count')
p
5.4 SparklyR
df1 <- df %>% select(host) %>% group_by(host) %>% summarise(noHosts=n()) %>% arrange(desc(noHosts)) df2 <-head(df1,10)
5.42 Plot count of hosts
p <-ggplot(data=df2, aes(x=host, y=noHosts,fill=host)) + geom_bar(stat=“identity”)+ theme(axis.text.x = element_text(angle = 90, hjust = 1)) + xlab(‘Host’) + ylab(‘Count’)
p
6 Paths
6.1 RDD
parsed_rdd2 = parsed_rdd.map(lambda line: map2groups(line))
rslt=(parsed_rdd2.map(lambda xx[5],1))
.reduceByKey(lambda a,b:a+b)
.takeOrdered(10, lambda x: -x[1]))
rslt
(‘”GET /images/KSC-logosmall.gif HTTP/1.0″‘, 164487),
(‘”GET /images/MOSAIC-logosmall.gif HTTP/1.0″‘, 126933),
(‘”GET /images/USA-logosmall.gif HTTP/1.0″‘, 126108),
(‘”GET /images/WORLD-logosmall.gif HTTP/1.0″‘, 124972),
(‘”GET /images/ksclogo-medium.gif HTTP/1.0″‘, 120704),
(‘”GET /ksc.html HTTP/1.0″‘, 83209),
(‘”GET /images/launch-logo.gif HTTP/1.0″‘, 75839),
(‘”GET /history/apollo/images/apollo-logo1.gif HTTP/1.0″‘, 68759),
(‘”GET /shuttle/countdown/ HTTP/1.0″‘, 64467)]
6.12 Plot counts of HTTP Requests
df=pd.DataFrame(rslt,columns=[‘path’,‘count’]) sns.barplot(x=‘path’,y=‘count’,data=df) plt.subplots_adjust(bottom=0.7, right=0.8, top=0.9) plt.xticks(rotation=“vertical”,fontsize=8)
display()

6.2 Pyspark
6.21 Compute count of HTTP Requests
df= (cleaned_df
.groupBy('path')
.count()
.orderBy('count',ascending=False))
df.show(5)
+——————–+——+
| path| count|
+——————–+——+
|/images/NASA-logo…|208362|
|/images/KSC-logos…|164813|
|/images/MOSAIC-lo…|127656|
|/images/USA-logos…|126820|
|/images/WORLD-log…|125676|
+——————–+——+
only showing top 5 rows
import pandas as pd import seaborn as sns df1=df.toPandas() df2 = df1.head(10) df2.count() sns.barplot(x=‘path’,y=‘count’,data=df2)
plt.subplots_adjust(bottom=0.7, right=0.8, top=0.9) plt.xlabel(“HTTP Requests”) plt.ylabel(‘Count’) plt.xticks(rotation=90,fontsize=8)
display()

6.3 SparkR
6.31Compute count of HTTP requests
c <- SparkR::select(a,a$path) df=SparkR::summarize(SparkR::groupBy(c, a$path), numRequest = count(a$path)) df1=head(df)
3.14 Plot count of HTTP Requests
p <-ggplot(data=df1, aes(x=path, y=numRequest,fill=path)) + geom_bar(stat="identity") + theme(axis.text.x = element_text(angle = 90, hjust = 1))+ xlab('Path') + ylab('Count')
p
6.4 SparklyR
6.41 Compute count of paths
df <- sdf %>% select(host,timestamp,path,status,content_size) df1 <- df %>% select(path) %>% group_by(path) %>% summarise(noPaths=n()) %>% arrange(desc(noPaths)) df2 <-head(df1,10) df2
# Ordered by: desc(noPaths)
path noPaths
1 /images/NASA-logosmall.gif 208362
2 /images/KSC-logosmall.gif 164813
3 /images/MOSAIC-logosmall.gif 127656
4 /images/USA-logosmall.gif 126820
5 /images/WORLD-logosmall.gif 125676
6 /images/ksclogo-medium.gif 121286
7 /ksc.html 83685
8 /images/launch-logo.gif 75960
9 /history/apollo/images/apollo-logo1.gif 68858
10 /shuttle/countdown/ 64695
6.42 Plot count of Paths
p <-ggplot(data=df2, aes(x=path, y=noPaths,fill=path)) + geom_bar(stat="identity")+ theme(axis.text.x = element_text(angle = 90, hjust = 1)) + xlab('Path') + ylab('Count')
p
7.1 RDD
7.11 Compute count of HTTP Status
parsed_rdd2 = parsed_rdd.map(lambda line: map2groups(line))
rslt=(parsed_rdd2.map(lambda xx[7],1))
.reduceByKey(lambda a,b:a+b)
.takeOrdered(10, lambda x: -x[1]))
rslt
(‘304’, 266764),
(‘302’, 72970),
(‘404’, 20625),
(‘403’, 225),
(‘500’, 65),
(‘501’, 41)]
1.37 Plot counts of HTTP response status’
df=pd.DataFrame(rslt,columns=[‘status’,‘count’]) sns.barplot(x=‘status’,y=‘count’,data=df) plt.subplots_adjust(bottom=0.4, right=0.8, top=0.9) plt.xticks(rotation=“vertical”,fontsize=8)
display()

7.2 Pyspark
.groupBy('status')
.count()
.orderBy('count',ascending=False))
status_count.show()
|status| count|
+——+——-+
| 200|3100522|
| 304| 266773|
| 302| 73070|
| 404| 20901|
| 403| 225|
| 500| 65|
| 501| 41|
| 400| 15|
| null| 1|
7.22 Plot count of HTTP status
df2 = df1.head(10) df2.count() sns.barplot(x=‘status’,y=‘count’,data=df2) plt.subplots_adjust(bottom=0.5, right=0.8, top=0.9) plt.xlabel(“HTTP Status”) plt.ylabel(‘Count’) plt.xticks(rotation=“vertical”,fontsize=10) display()

7.3 SparkR
c <- SparkR::select(a,a$status) df=SparkR::summarize(SparkR::groupBy(c, a$status), numStatus = count(a$status)) df1=head(df)
p <-ggplot(data=df1, aes(x=status, y=numStatus,fill=status)) + geom_bar(stat="identity") + theme(axis.text.x = element_text(angle = 90, hjust = 1)) + xlab('Status') + ylab('Count')
p
7.4 SparklyR
7.41 Compute count of status
df <- sdf %>% select(host,timestamp,path,status,content_size) df1 <- df %>% select(status) %>% group_by(status) %>% summarise(noStatus=n()) %>% arrange(desc(noStatus)) df2 <-head(df1,10) df2
# Ordered by: desc(noStatus)
status noStatus
1 200 3100522
2 304 266773
3 302 73070
4 404 20901
5 403 225
6 500 65
7 501 41
8 400 15
9 "" 1
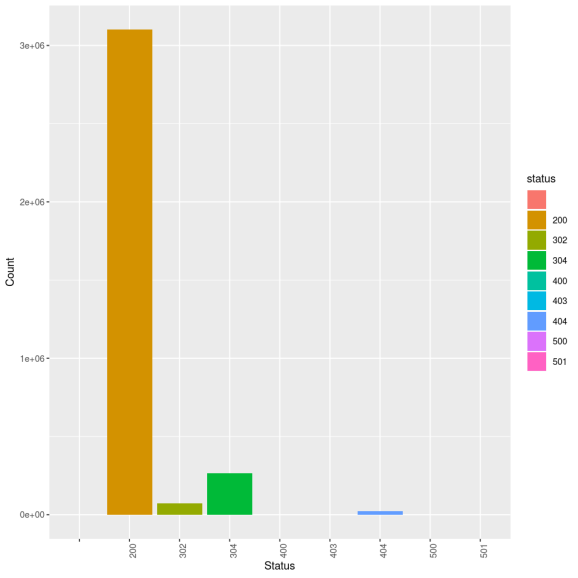
7.42 Plot count of status
p <-ggplot(data=df2, aes(x=status, y=noStatus,fill=status)) + geom_bar(stat=“identity”)+ theme(axis.text.x = element_text(angle = 90, hjust = 1)) + xlab(‘Status’) + ylab(‘Count’) p
8.1 RDD
8.12 Compute count of content size
parsed_rdd = rdd.map(lambda line: parse_log2(line)).filter(lambda line: line[1] == 1).map(lambda line : line[0])
parsed_rdd2 = parsed_rdd.map(lambda line: map2groups(line))
rslt=(parsed_rdd2.map(lambda xx[8],1))
.reduceByKey(lambda a,b:a+b)
.takeOrdered(10, lambda x: -x[1]))
rslt
[(‘0’, 280017),
(‘786’, 167281),
(‘1204’, 140505),
(‘363’, 111575),
(‘234’, 110824),
(‘669’, 110056),
(‘5866’, 107079),
(‘1713’, 66904),
(‘1173’, 63336),
(‘3635’, 55528)]
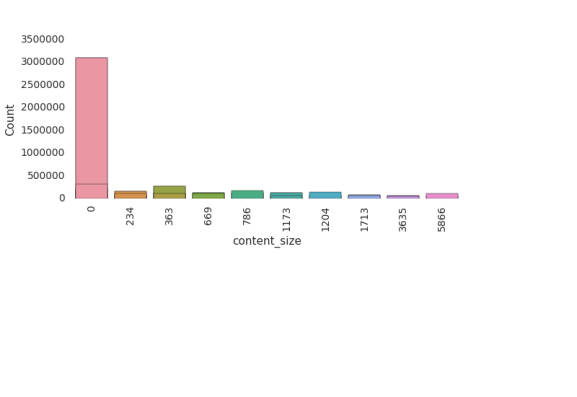
8.21 Plot content size
df=pd.DataFrame(rslt,columns=[‘content_size’,‘count’]) sns.barplot(x=‘content_size’,y=‘count’,data=df) plt.subplots_adjust(bottom=0.4, right=0.8, top=0.9) plt.xticks(rotation=“vertical”,fontsize=8) display()

8.2 Pyspark
.groupBy('content_size')
.count()
.orderBy('count',ascending=False))
size_counts.show(10)
+------------+------+
|content_size| count|
+------------+------+
| 0|313932|
| 786|167709|
| 1204|140668|
| 363|111835|
| 234|111086|
| 669|110313|
| 5866|107373|
| 1713| 66953|
| 1173| 63378|
| 3635| 55579|
+------------+------+
only showing top 10 rows
df2 = df1.head(10) df2.count() sns.barplot(x=‘content_size’,y=‘count’,data=df2) plt.subplots_adjust(bottom=0.5, right=0.8, top=0.9) plt.xlabel(“content_size”) plt.ylabel(‘Count’) plt.xticks(rotation=“vertical”,fontsize=10) display()
8.3 SparkR
8.31 Compute count of content size
library(SparkR) c <- SparkR::select(a,a$content_size) df=SparkR::summarize(SparkR::groupBy(c, a$content_size), numContentSize = count(a$content_size)) df1=head(df) df1
1 28426 1414 2 78382 293 3 60053 4 4 36067 2 5 13282 236 6 41785 174
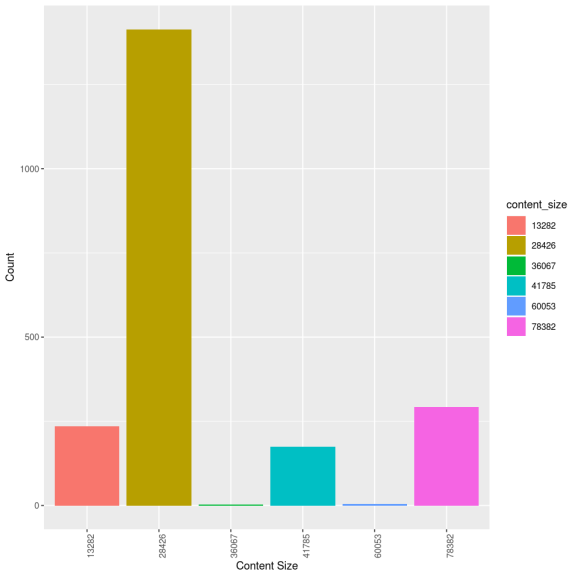
p <-ggplot(data=df1, aes(x=content_size, y=numContentSize,fill=content_size)) + geom_bar(stat=“identity”) + theme(axis.text.x = element_text(angle = 90, hjust = 1)) + xlab(‘Content Size’) + ylab(‘Count’)
p
8.4 SparklyR
df1 <- df %>% select(content_size) %>% group_by(content_size) %>% summarise(noContentSize=n()) %>% arrange(desc(noContentSize)) df2 <-head(df1,10) df2
# Ordered by: desc(noContentSize)
content_size noContentSize
1 0 280027
2 786 167709
3 1204 140668
4 363 111835
5 234 111086
6 669 110313
7 5866 107373
8 1713 66953
9 1173 63378
10 3635 55579
8.42 Plot count of content_size
p <-ggplot(data=df2, aes(x=content_size, y=noContentSize,fill=content_size)) + geom_bar(stat="identity")+ theme(axis.text.x = element_text(angle = 90, hjust = 1)) + xlab('Content size') + ylab('Count')
p
Conclusion: I spent many,many hours struggling with Regex and getting RDDs,Pyspark to work. Also had to spend a lot of time trying to work out the syntax for SparkR and SparklyR for parsing. After you parse the logs plotting and analysis is a piece of cake! This is definitely worth a try!
Watch this space!!
Also see
1. Practical Machine Learning with R and Python – Part 3
2. Deep Learning from first principles in Python, R and Octave – Part 5
3. My book ‘Cricket analytics with cricketr and cricpy’ is now on Amazon
4. Latency, throughput implications for the Cloud
5. Modeling a Car in Android
6. Architecting a cloud based IP Multimedia System (IMS)
7. Dabbling with Wiener filter using OpenCV
To see all posts click Index of posts
R-bloggers.com offers daily e-mail updates about R news and tutorials about learning R and many other topics. Click here if you're looking to post or find an R/data-science job.
Want to share your content on R-bloggers? click here if you have a blog, or here if you don't.
1.1 Read NASA Web server logs
Read the logs files from NASA for the months Jul 95 and Aug 95
from pyspark.sql import SQLContext

conf = SparkConf().setAppName("Spark-Logs-Handling").setMaster("local[*]")
sc = SparkContext.getOrCreate(conf)

sqlcontext = SQLContext(sc)
rdd = sc.textFile("/FileStore/tables/NASA_access_log_*.gz")
rdd.count()
Out[1]: 3461613