March 2019

Wrapping up the stars project

March 29, 2019 | Edzer Pebesma

Summary Status Future Earlier stars blogs [view raw Rmd] Summary 
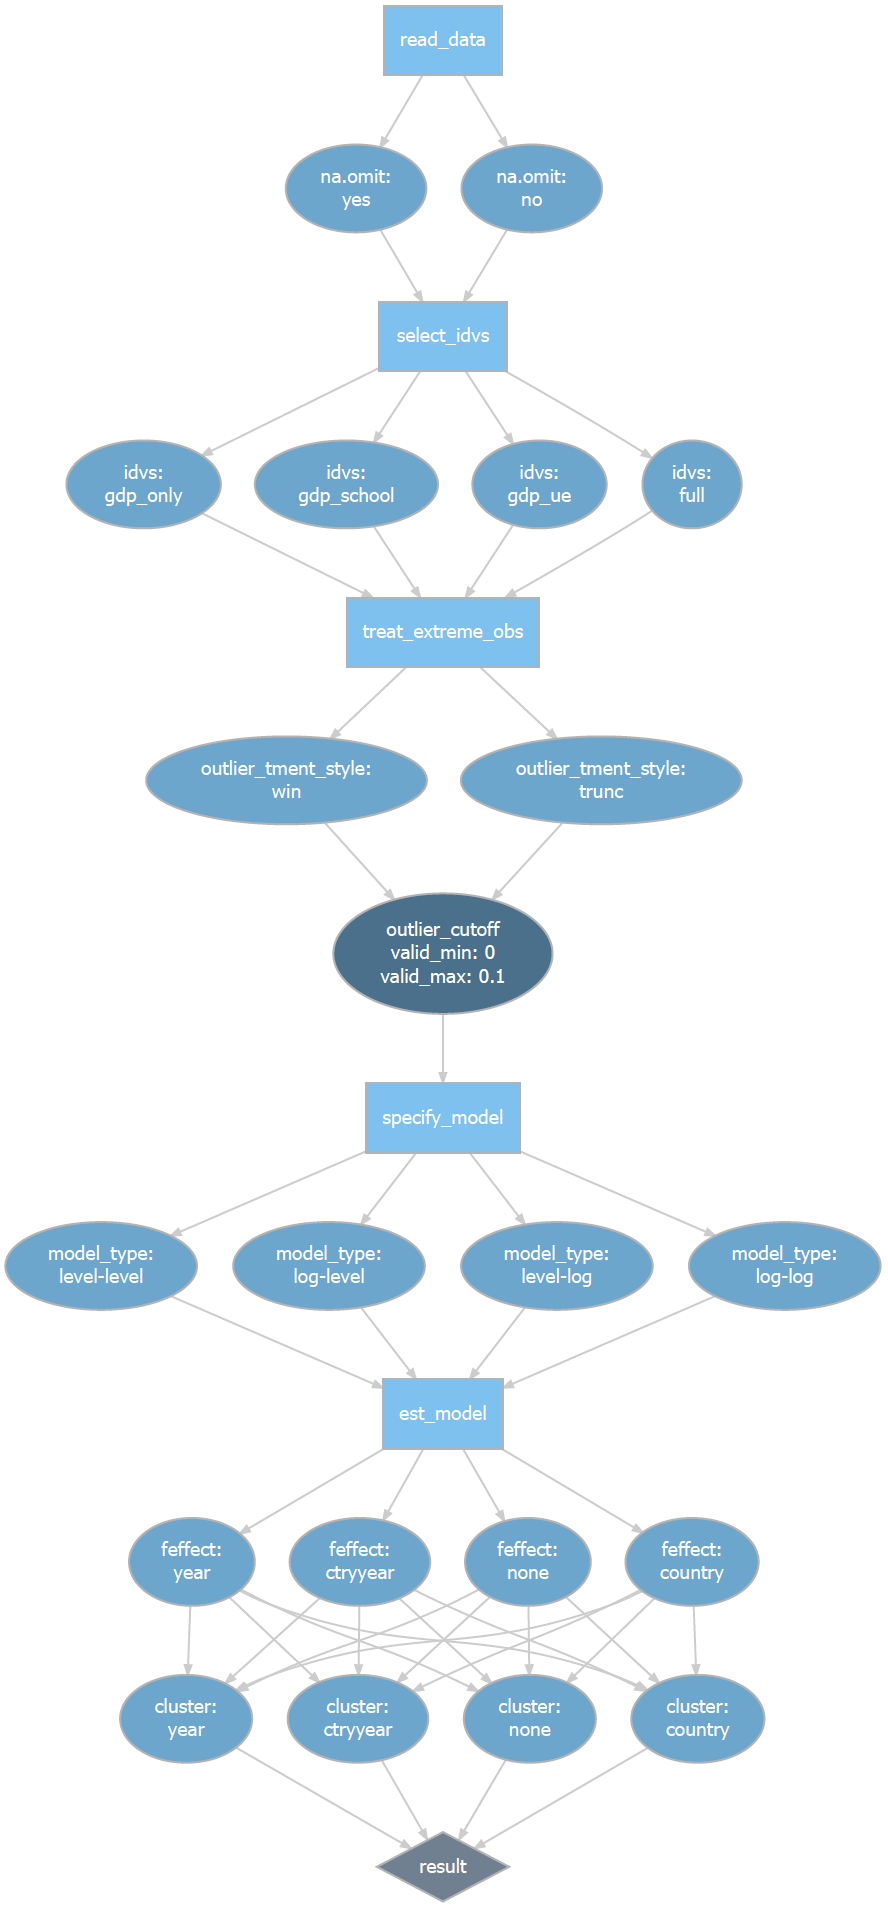
This is the fourth blog on the stars project, an it completes the R-Consortium funded project for spatiotemporal tidy arrays with R. It reports on the current status of the... [Read more...]

Quick Control Charts for AFL

March 29, 2019 | Analysis of AFL

Who doesn’t like a wikipedia entry control chart If analysis of the control chart indicates that the process is currently under control (i.e., is stable, with variation only coming from sources common to the process), then no corrections or changes to process control parameters are needed or desired ...
[Read more...]

no country for old liars

March 29, 2019 | xi'an

A puzzle from the Riddler about a group of five persons, A,..,E, where all and only people strictly older than L are liars, all making statements about others’ ages: A: B__20 and D__16 B: C__18 and E [Read more...]

drat 0.1.5: New release

March 28, 2019 | Thinking inside the box

A new version of drat just arrived on CRAN. And like the last time in December 2017 it went through as an automatically processed upgrade directly from the CRAN prechecks. Being a simple package can have its upsides… And like the last time, this r... [Read more...]

Visualising Model Response with easyalluvial

March 28, 2019 | R on datistics

In this tutorial I want to show how you can use alluvial plots to visualise model response in up to 4 dimensions. easyalluvial generates artificial data space using fixed values for unplotted variables or uses the partial dependence plotting method. It is model agnostic but offers some convenient wrappers for caret ...
[Read more...]

Le Monde puzzle [#1088]

March 28, 2019 | xi'an

A board (Ising!) Le Monde mathematical puzzle in the optimisation mode, again: On a 7×7 board, what is the maximal number of locations that one can occupy when imposing at least two empty neighbours ? Which I tried to solve by brute force and simulated annealing (what else?!), first defining a target ...
[Read more...]

Using RStudio and LaTeX

March 28, 2019 | experimentalbehaviour

This post will explain how to integrate RStudio and LaTeX, especially the inclusion of well-formatted tables and nice-looking graphs and figures produced in RStudio and imported to LaTeX. To follow along you will need RStudio, MS Excel and LaTeX. Using tikzdevice to insert R Graphs into LaTeX I am a ... [Read more...]

Super Dark IDE Theme, R-Studio, Inverted Color

March 27, 2019 | Kenith Grey

A dark IDE theme may increase visual comfort and productivity for those spending extended amounts of time coding, writing, and reading at a computer terminal. Why? If your 9 to 5 has you chained to a computer, you’ve likely experienced eye strain. Typical symptoms include soreness, irritation, and difficulty focusing your ...
[Read more...]

The end of errors in ANOVA reporting

March 27, 2019 | R on easystats

Psychological science is still massively using analysis of variance (ANOVA). Despite its relative simplicity, I am very often confronted to errors in its reporting, for instance in student’s theses or manuscripts, or even published papers (See th... [Read more...]
1 2 3 4 16

Never miss an update!
Subscribe to R-bloggers to receive
e-mails with the latest R posts.
(You will not see this message again.)

Click here to close (This popup will not appear again)