Smartly select and mutate data frame columns, using dict
Motivation
Column operations
Add
Modify
Remove
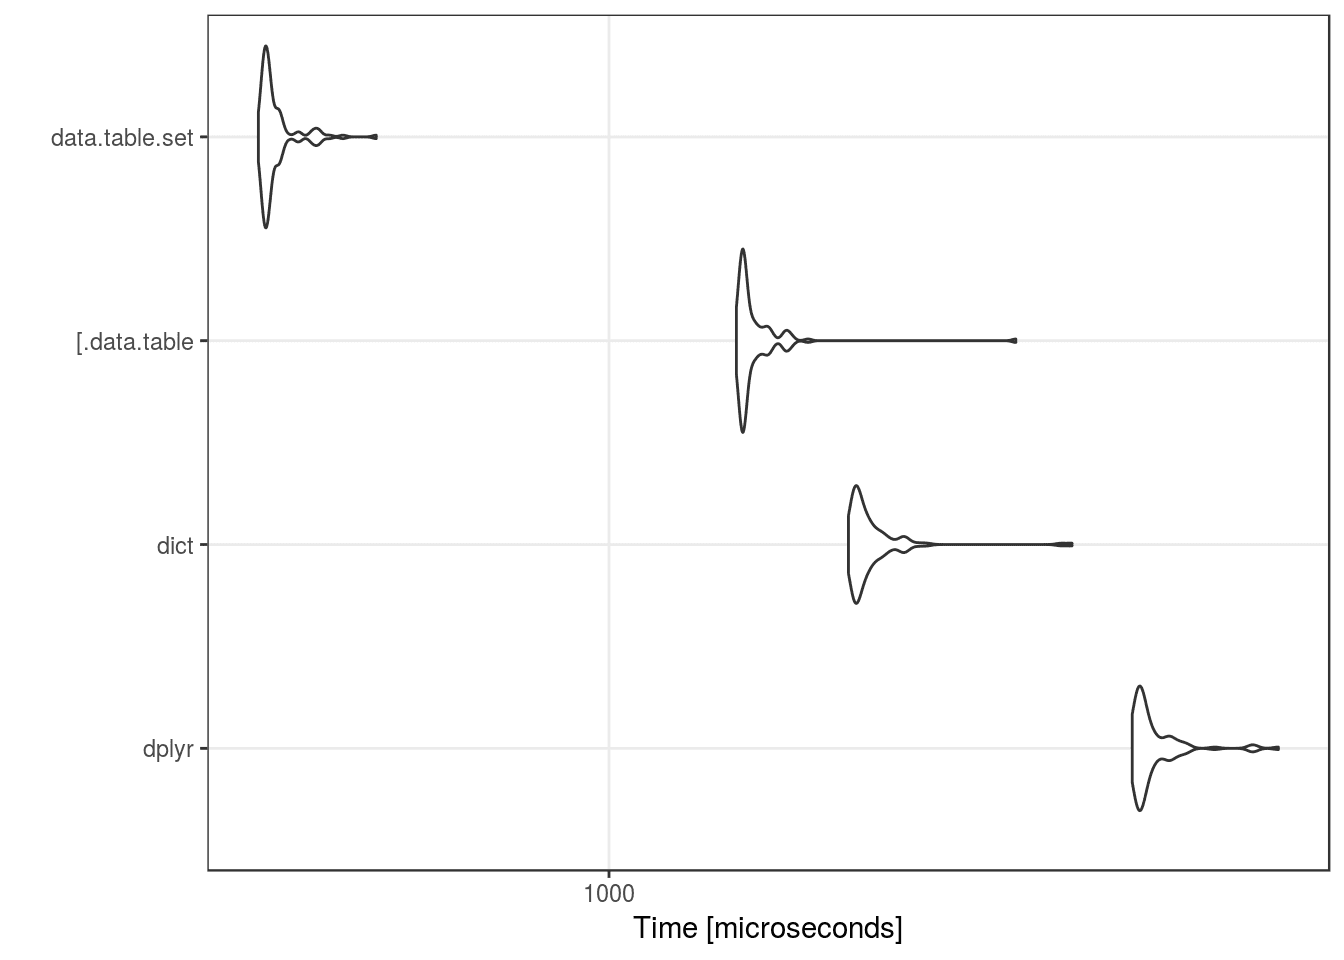
Benchmark
Summary
Motivation
The dplyr functions select and mutate nowadays are commonly applied to perform data.frame column operations, frequently combined with magrittrs forward %__% pipe. While working well interactively, however, these methods often would require additional checking if used in “serious” code, for example, ...