October 2018

Examining Inter-Rater Reliability in a Reality Baking Show

October 18, 2018 | Mattan S.

Game of Chefs is an Israeli reality cooking competition show, where chefs compete for the title of "Israel's most talented chef". The show has four stages: blind auditions, training camp, kitchen battles, and finals. Here I will examine the 4th season's (Game of Chefs: Confectioner) inter-rater reliability in the blind ...
[Read more...]

Analyzing English Team of the Year Data Since 1973

October 17, 2018 | Stefan Gouyet

The Professional Footballers’ Association (PFA) Team of the Year is released in England at the end of each season, picking the 11 most influential players in each of Britain’s leagues. The Team of the Year award was launched in the 1973-1974 season, meaning there was 44 years worth of data to ...
[Read more...]

SatRday talks recordings

October 17, 2018 | Longhow Lam

A couple of weeks ago, the first of September we had satRday in Amsterdam (The Netherlands) a fantastic event hosted by GoDataDriven. Now the great talks, including my 10 minute lightning talk on text2vec are online. My talk The satRday … Continue reading →
[Read more...]

Estimating Control Chart Constants with R

October 16, 2018 | Kenith Grey

In this post, I will show you how a very basic R code can be used to estimate quality control constants needed to construct X-Individuals, X-Bar, and R-Bar charts. The value of this approach is that it gives you a mechanical sense of where these constants come from and some ... [Read more...]

Cannibus Curve with ggplot2

October 16, 2018 | R on Chi's Impe[r]fect Blog

Starting today, recreational weed is legal in Canada. This news has some how lead me to find Cannibus Curve, a mathmatical equation to draw Cannibus….!!! So to celebrate? being 2nd country in the world (1st was Uruguay) to legalize the green stuff for fun, I decided I’ll try drawing ...
[Read more...]

Even more images as x-axis labels

October 16, 2018 | Jonathan Carroll

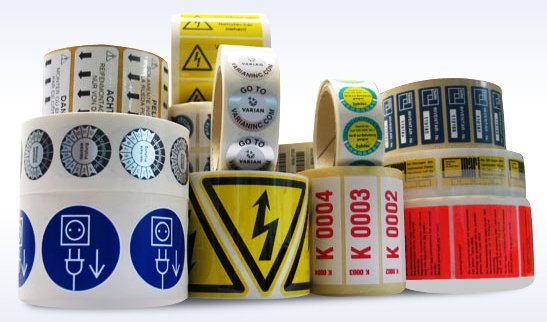
This is the last update to this strange saga… I hope. Image labels… Photo: http://www.premierpaper.com/shop/custom-labels/ Easily two of the most popular posts on my blog are this one and this one describing a couple of ways in which I managed to hack together using an ...
[Read more...]

Estimating Pi

October 16, 2018 | aghaynes

I came across this post which gives a method to estimate Pi by using a circle, it’s circumscribed square and (lots of) random points within said square. Booth used Stata to estimate Pi, but here’s some R code to do the same thing… x [Read more...]

Quasiquotation in R via bquote()

October 16, 2018 | John Mount

In August of 2003 Thomas Lumley added bquote() to R 1.8.1. This gave R and R users an explicit Lisp-style quasiquotation capability. bquote() and quasiquotation are actually quite powerful. Professor Thomas Lumley should get, and should continue to receive, a lot of credit and thanks for introducing the concept into R. In ... [Read more...]

A small logical change with big impact

October 16, 2018 | David Smith

In R, the logical || (OR) and && (AND) operators are unique in that they are designed only to work with scalar arguments. Typically used in statements like while(iter __ 1000 && eps __ 0.0001) continue_optimization() the assumption is that the objects on either side (in the example above, iter and eps) are single values (... [Read more...]

An introduction to Shiny II

October 15, 2018 | R on Coding Club UC3M

This is our second session introducing Shiny, an R package that allows to develop interactive Apps in a familiar framework for regular R-users. During the first session we focused on the structure and workflow basics, and now, we will go further on input and output objects, reactivity, layouts and data ...
[Read more...]
1 5 6 7 8 9 15

Never miss an update!
Subscribe to R-bloggers to receive
e-mails with the latest R posts.
(You will not see this message again.)

Click here to close (This popup will not appear again)