September 2018

Data Wrangling with dplyr – Part 2

September 3, 2018 | Rsquared Academy Blog

Introduction In the previous post we learnt about dplyr verbs and used them to compute average order value for an online retail company data. In this post, we will 
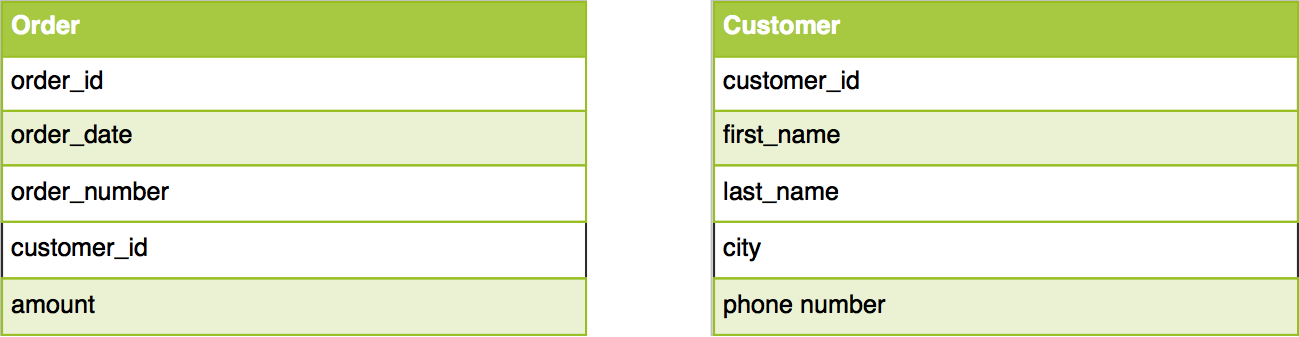
learn to combine tables using different *_join functions provided in dplyr. Libraries, Code & Data We will use the following packages: dplyr ...
[Read more...]

How to Build a Shiny “Truck”!

September 3, 2018 | R Views

Why is this about trucks? Last month, at the R/Pharma conference that took place on the Harvard Campus, I presented bioWARP, a large Shiny application containing more than 500,000 lines of code. Although several other Shiny apps were presented at the conference, I noticed that none of them came close ...
[Read more...]

ABC in Montréal

September 3, 2018 | xi'an

There will be a symposium on ABC in Montréal this coming December, the day before NIPS, in a continuation of past years NIPS workshops. While invited speakers and panelists have been selected by the committee, a call for papers is open. Note that in continuation with the best “ABC ...
[Read more...]

Playing Map() and Reduce() in R – By-Group Calculation

September 3, 2018 | statcompute

Clojure is such an interesting programming language that it can not only enhance our skill set but also change the way how we should write the program. After learning Clojure, I can’t help thinking about how to employ the functional programming and MapReduce paradigm to improve our experience with ... [Read more...]

Update on R Consortium Census Guide

September 3, 2018 | Ari Lamstein

As I mentioned in July, my proposal to the R Consortium to create a Guide to Working with Census Data in R was accepted. Today I’d like... The post Update on R Consortium Census Guide appeared first on AriLamstein.com.
[Read more...]

An Ode to DiagrammeR

September 3, 2018 | Rich Pugh

When our Chief Data Scientist, Rich Pugh, offered to write a blogpost about the DiagrammeR package, he asked what format we’d like it in.  “A poem?” we retorted. He didn’t disappoint….   Gather ye and listen to my tale of daring do, Of heroes, villains, diagrams – and a chunk ... [Read more...]

daqana’s R style guide is online

September 3, 2018 | Mirjam Rehr

It is an enhanced version of the tidyverse style guide (http://style.tidyverse.org/). What is a style guide and why do we need it? A style guide provides programmers with rules specifying how their code should be written. To be functional code has to be in line with a ... [Read more...]

Kruskal-Wallis One-Way Analysis of Variance of Ranks

September 3, 2018 | Aaron Schlegel

The Kruskal-Wallis test extends the Mann-Whitney-Wilcoxon Rank Sum test for more than two groups. The test is nonparametric similar to the Mann-Whitney test and as such does not assume the data are normally distributed and can, therefore, be used when the assumption of normality is violated. This example will employ ... [Read more...]

Animating the Premier League using gganimate

September 2, 2018 | Jumping Rivers

Ever wonder what an evolving gif of each premier league team’s goal difference vs points would look like made in R? Look no further! Most of this is going to be setting up the data (as always) instead of actually plotting the data. To get the data into shape, ...
[Read more...]

Flat Earth Mathematics in the R Language

September 1, 2018 | Peter Prevos

I am soon embarking on a trip around the world to speak at the World Water Congress in Tokyo, visit family and friends in the Netherlands and some tourism in San Francisco. One of the workshops I am involved with is about Fake News in the water industry. Fake news ...
[Read more...]

Shiny Gadget: Fit Distributions

September 1, 2018 | R on Thomas Roh

The ‘Fit Distributions’ shiny gadget allows easy automated diagnostics for fitting univariate distributions. It reads in numeric vectors in the global environment, and uses MLE to estimate the parameters of the selected distributions. The visual outputs are GOF statistics, density plot, pp-plot, and qq-plot. You can also adjust the number ... [Read more...]

R tip: How to Pass a formula to lm

September 1, 2018 | John Mount

R tip : how to pass a formula to lm(). Often when modeling in R one wants to build up a formula outside of the modeling call. This allows the set of columns being used to be passed around as a vector of strings, and treated as data. Being able to ... [Read more...]
1 12 13 14 15

Never miss an update!
Subscribe to R-bloggers to receive
e-mails with the latest R posts.
(You will not see this message again.)

Click here to close (This popup will not appear again)