
Gartner’s 2018 Take on Data Science Tools
Want to share your content on R-bloggers? click here if you have a blog, or here if you don't.
I’ve just updated The Popularity of Data Science Software to reflect my take on Gartner’s 2018 report, Magic Quadrant for Data Science and Machine Learning Platforms. To save you the trouble of digging though all 40+ pages of my report, here’s just the new section:
IT Research Firms
IT research firms study software products and corporate strategies, they survey customers regarding their satisfaction with the products and services, and then provide their analysis on each in reports they sell to their clients. Each research firm has its own criteria for rating companies, so they don’t always agree. However, I find the detailed analysis that these reports contain extremely interesting reading. While these reports focus on companies, they often also describe how their commercial tools integrate open source tools such as R, Python, H2O, TensoFlow, and others.
While these reports are expensive, the companies that receive good ratings usually purchase copies to give away to potential customers. An Internet search of the report title will often reveal the companies that are distributing such free copies.
Gartner, Inc. is one of the companies that provides such reports. Out of the roughly 100 companies selling data science software, Gartner selected 16 which had either high revenue, or lower revenue combined with high growth (see full report for details). After extensive input from both customers and company representatives, Gartner analysts rated the companies on their “completeness of vision” and their “ability to execute” that vision. Hereafter, I refer to these as simply vision and ability. Figure 3a shows the resulting “Magic Quadrant” plot for 2018, and 3b shows the plot for the previous year.
The Leader’s Quadrant is the place for companies who have a future direction in line with their customer’s needs and the resources to execute that vision. The further to the upper-right corner, the better the combined score. KNIME is in the prime position, with H2O.ai showing greater vision but lower ability to execute. This year KNIME gained the ability to run H2O.ai algorithms, so these two may be viewed as complementary tools rather than outright competitors.
Alteryx and SAS have nearly the same combined scores, but note that Gartner studied only SAS Enterprise Miner and SAS Visual Analytics. The latter includes Visual Statistics, and Visual Data Mining and Machine Learning. Excluded was the SAS System itself since Gartner focuses on tools that are integrated. This lack of integration may explain SAS’ decline in vision from last year.
KNIME and RapidMiner are quite similar tools as they are both driven by an easy to use and reproducible workflow interface. Both offer free and open source versions, but the companies differ quite a lot on how committed they are to the open source concept. KNIME’s desktop version is free and open source and the company says it will always be so. On the other hand, RapidMiner is limited by a cap on the amount of data that it can analyze (10,000 cases) and as they add new features, they usually come only via a commercial license. In the previous year’s Magic Quadrant, RapidMiner was slightly ahead, but now KNIME is in the lead.
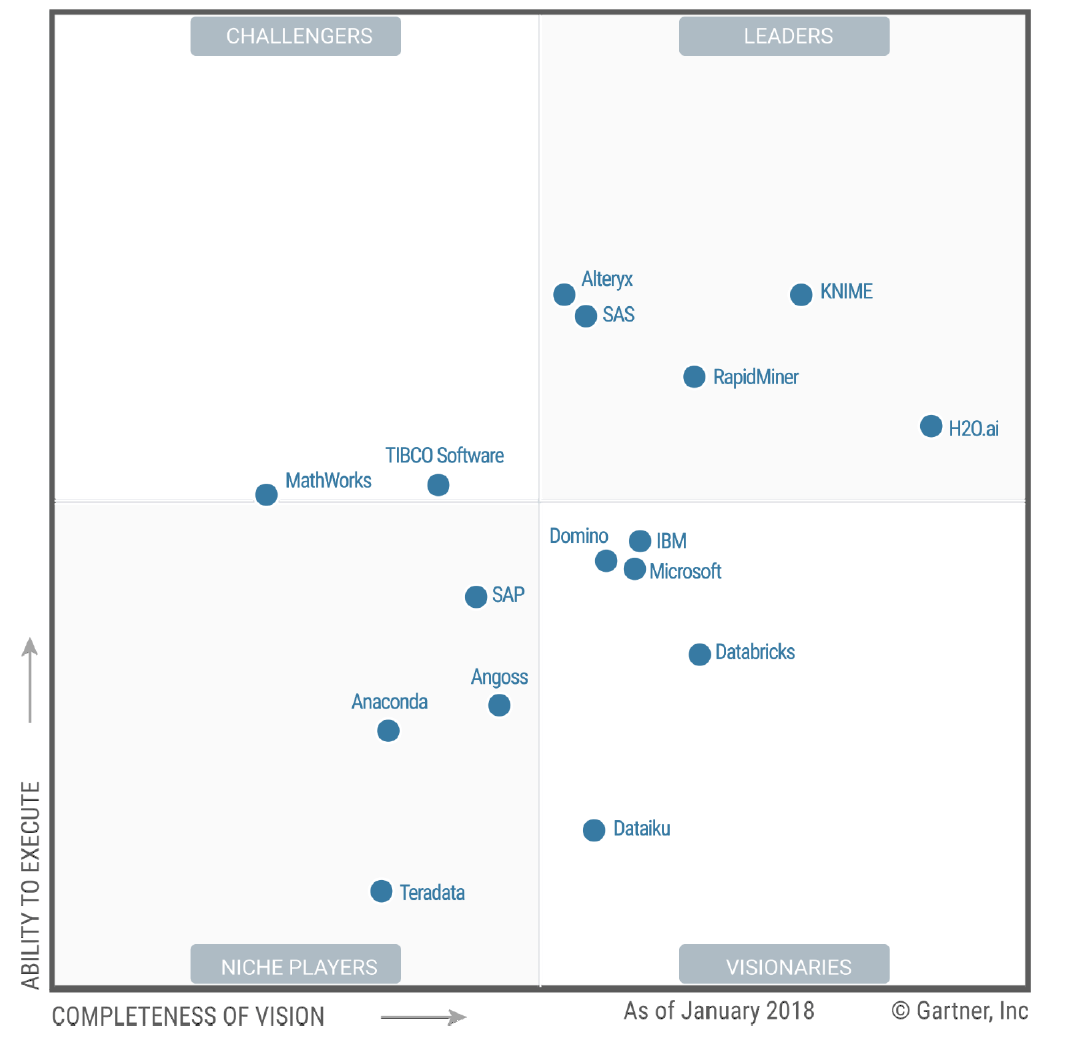
Figure 3a. Gartner Magic Quadrant for Data Science and Machine Learning Platforms

Figure 3b. Gartner Magic Quadrant for Data Science Platforms 2017.
The companies in the Visionaries Quadrant are those that have a good future plans but which may not have the resources to execute that vision. Of these, IBM took a big hit by landing here after being in the Leader’s Quadrant for several years. Now they’re in a near-tie with Microsoft and Domino. Domino shot up from the bottom of that quadrant to towards the top. They integrate many different open source and commercial software (e.g. SAS, MATLAB) into their Domino Data Science Platform. Databricks and Dataiku offer cloud-based analytics similar to Domino, though lacking in access to commercial tools.
Those in the Challenger’s Quadrant have ample resources but less customer confidence on their future plans, or vision. Mathworks, the makers of MATLAB, continues to “stay the course” with its proprietary tools while most of the competition offers much better integration into the ever-expanding universe of open source tools. Tibco replaces Quest in this quadrant due to their purchase of Statistica. Whatever will become of the red-headed stepchild of data science? Statistica has been owned by four companies in four years! (Statsoft, Dell, Quest, Tibco) Users of the software have got to be considering other options. Tibco also purchased Alpine Data in 2017, accounting for its disappearance from Figure 3b to 3a.
Members of the Niche Players quadrant offer tools that are not as broadly applicable. Anaconda is new to Gartner coverage this year. It offers in-depth support for Python. SAP has a toolchain that Gartner calls “fragmented and ambiguous.” Angoss was recently purchased by Datawatch. Gartner points out that after 20 years in business, Angoss has only 300 loyal customers. With competition fierce in the data science arena, one can’t help but wonder how long they’ll be around. Speaking of deathwatches, once the king of Big Data, Teradata has been hammered by competition from open source tools such as Hadoop and Spark. Teradata’s net income was higher in 2008 than it is today.
As of 2/26/2018, RapidMiner is giving away copies of the Gartner report here.
R-bloggers.com offers daily e-mail updates about R news and tutorials about learning R and many other topics. Click here if you're looking to post or find an R/data-science job.
Want to share your content on R-bloggers? click here if you have a blog, or here if you don't.