
Volatility modelling in R exercises (Part-3)
Want to share your content on R-bloggers? click here if you have a blog, or here if you don't.
This is the third part of the series on volatility modelling. For other parts of the series follow the tag volatility.
In this exercise set we will use GARCH models to forecast volatility.
Answers to the exercises are available here.
Exercise 1
Load the rugarch and the FinTS packages. Next, load the m.ibmspln dataset from the FinTS package. This dataset contains monthly excess returns of the S&P500 index from Jan-1926 to Dec-1999 (Ruey Tsay (2005) Analysis of Financial Time Series, 2nd ed. ,Wiley, chapter 3).
Also, load the forecast package which we will use for auto-correlation graphs.
Exercise 2
Excess S&P500 returns are defined as a regular zoo variable. Convert this to a time series variable with correct dates.
Exercise 3
Plot the excess S&P500 returns along with its ACF and PACF graphs and comment on the apparent correlation.
Exercise 4
Plot the squared excess S&P500 returns along with its ACF and PACF graphs and comment on the apparent correlation.
- Avoid model over-fitting using cross-validation for optimal parameter selection
- Explore maximum margin methods such as best penalty of error term support vector machines with linear and non-linear kernels.
- And much more
Exercise 5
Using the results from exercise-3, estimate a suitable ARMA model for excess returns assuming normal errors.
Exercise 6
Using the results from exercise-4, estimate a suitable ARMA model for excess returns without assuming normal errors.
Exercise 7
Using the results from exercises 5 and 6, estimate a more parsimonious model that has better fit.
Exercise 8
Generate 10 steps ahead forecast for the model from exercise-7
Exercise 9
Plot the excess returns forecast.
Exercise 10
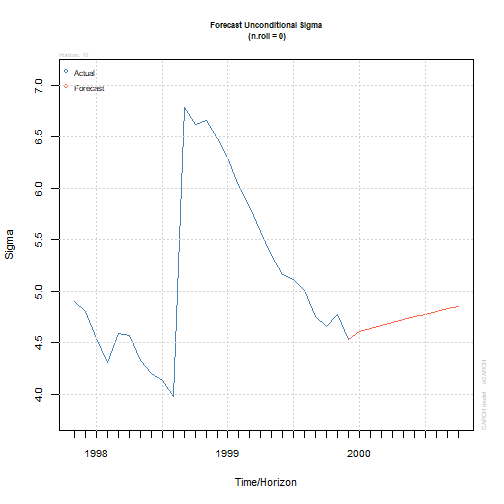
Plot the volatility forecast.
R-bloggers.com offers daily e-mail updates about R news and tutorials about learning R and many other topics. Click here if you're looking to post or find an R/data-science job.
Want to share your content on R-bloggers? click here if you have a blog, or here if you don't.