
The nhmrcData package: NHMRC funding outcomes data made tidy
Want to share your content on R-bloggers? click here if you have a blog, or here if you don't.
Do you like R? Information about Australian biomedical research funding outcomes? Tidy data? If the answers to those questions are “yes”, then you may also like nhmrcData, a collection of datasets derived from funding statistics provided by the Australian National Health & Medical Research Council. It’s also my first R package (more correctly, R data package).
Read on for the details.
1. Installation
The package is hosted at Github and is in a subdirectory of a top-level repository, so it can be installed using the devtools package, then loaded in the usual way:
devtools::install_github("neilfws/politics", subdir = "nhmrcData",
                          build_vignettes = TRUE)

library(nhmrcData)
There are currently 14 datasets in the package. No need to type data(); they are “lazy-loaded”, so just start typing “nhmrc” then hit Tab to see their names. The datasets are (somewhat) documented and briefly described in the repository README so for this post, I’ll focus on just four examples: those related to gender.
2. Examples
Example code is (or will be) in the package vignette (I’m a bit over copy-pasting code to WordPress). Here are the results.
2.1 nhmrcOutcomesGenderBRA
 The
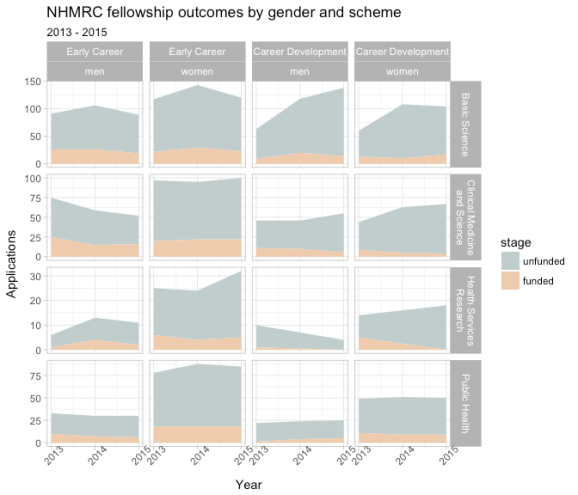
The nhmrcOutcomesGenderBRA dataset contains information on funding outcomes by gender, fellowship scheme and broad research area for 2013 – 2015. Here’s an attempt to capture all of that in an area plot.
Mmm, look at those success rates. My qualitative first impression is that there are more women applicants in several categories, without a corresponding increase in funded proposals.
2.2 nhmrcOutcomesGenderFellows
 The
The nhmrcOutcomesGenderFellows dataset also summarises outcomes by fellowship scheme, this time broken down into levels.
What’s interesting here is the difference in numbers by gender after the career development stage.
2.3 nhmrcOutcomesGenderPartTime
 The
The nhmrcOutcomesGenderPartTime dataset looks at the relatively-small number of part-time fellowship applications.
I tried to create this chart in the style of a “population pyramid”, to contrast directly the numbers by gender. Looks rather like women could use more part-time opportunities earlier in their careers.
2.4 nhmrcOutcomesGenderScheme
 Finally, the
 nhmrcOutcomesGenderScheme dataset: yet another summary by fellowship scheme but this time, broken down into 29 categories, such as “Australian Biomedical (Peter Doherty)”.
That’s the category I chose to display here and again, it indicates that more women are trying as hard or harder, yet this is not reflected in funding rates.
Of course, these charts are exploratory qualitative observations and it would be useful to apply some statistical tests where appropriate.
3. Thoughts on publicly-available data and tidyness
It’s great when organisations make their data available, but the next step is making it usable. Excel files is a start – but why are they always so dreadfully-formatted? The answer of course is that people cannot decide whether Excel is a database or a presentation tool (it is neither), so we end up with the worst of all worlds. PDF as a data source is just plain wrong, end of story. For this project I used the excellent tabulizer package to extract PDF tables into R matrices, followed by a lot of customised, manual cleaning which was impossible to automate or to make reproducible. The best that I could do was to dump the results as CSV files in the package data-raw directory.
Given that organisations struggle to get even the basics of data correct, I suppose hoping for some consideration of tidyness is wildly optimistic. So many spreadsheets with a header row of years (2000, 2001, 2002…) as opposed to a column named year. The tidy philosophy certainly makes manipulation and visualisation using R much easier, though I note that the occasional “spread” to wide format is still required for certain calculations. For example, funding outcomes are often expressed as total applications and successful applications. When those values are stored in the same column, it’s easier to calculate the number of unsuccessful applications (total – successful) by spreading to two columns, then gathering back again.
4. Thoughts on package writing
I’ve long wanted to write an R package but like many people, I kept putting it into the “too hard just now” basket. This is no longer the case thanks to some excellent resources. The first of these of course is RStudio itself, which includes several tools to facilitate package writing, building, testing and documentation. For an overview, start here. There are also many excellent online guides and tutorials. One such resource (which includes links to others) is Karl Broman’s R package primer.
Time will tell how easy it will be to update the package with new NHMRC data. In the meantime, I hope some of you find this useful and welcome your constructive feedback.
Filed under: R, statistics

R-bloggers.com offers daily e-mail updates about R news and tutorials about learning R and many other topics. Click here if you're looking to post or find an R/data-science job.
Want to share your content on R-bloggers? click here if you have a blog, or here if you don't.