
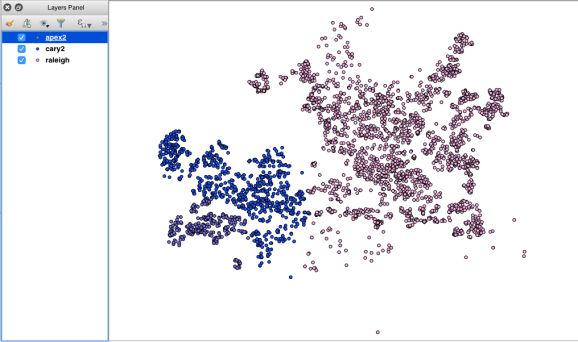
Mapping Housing Data with R
Want to share your content on R-bloggers? click here if you have a blog, or here if you don't.
What is my home worth? Many homeowners in America ask themselves this question, and many have an answer. What does the market think, though? The best way to estimate a property’s value is by looking at other, similar properties that have sold recently in the same area – the comparable sales approach. In an effort to allow homeowners to do some exploring (and because I needed a new project), I developed a small Shiny app with R.
My day job allows me access to the local multiple listing service, which provides a wealth of historic data. The following project makes use of that data to map real estate that has sold near Raleigh, NC in the past six months. Without getting too lost in the weeds I’ll go over a few key parts of the process. Feel free to jump over to my GitHub page to check out the full source code. Click here to view the app!
- Geocode everything. The data did not come with latitude and longitude coordinates, so we’ll have to do some geocoding. I haven’t found an efficient way to do this in R, so, like in the mailing list example, I’ll use QGIS to process my data and return a .csv for each town I’m interested in.
- Setup your data. To make sure that everything runs smoothly later on, we’ve got to import our data using
readrand make sure each attribute is typed properly.library(readr) apex <- read_csv("apex2.csv") #Remove non-character elements from these columns. df$`Sold Price` <- as.numeric(gsub("[^0-9]","",df$`Sold Price`)) df$`List Price` <- as.numeric(gsub("[^0-9]","",df$`List Price`)) #Some re-typing for later. df$Fireplace <- as.numeric(df$Fireplace) df$`New Constr` <- as.factor(df$`New Constr`) #Assign some placeholders. assign("latitude", NA, envir = .GlobalEnv) assign("longitude", NA, envir = .GlobalEnv) - Get info from the user. The first thing the app wants you to do is give it some characteristics about the subject property, a property that you are interested in valuating. A function further down uses this information to produce a map using these inputs.
#What city's dataset are we using? selectInput("city", label = "City", c("Apex", "Cary", "Raleigh")) #Get some info. textInput("address",label = "Insert Subject Property Address", value = "2219 Walden Creek Drive"), numericInput("dist", label = "Miles from Subject", value = 5, max = 20), numericInput("footage",label = "Square Footage", value = 2000), selectInput("acres",label = "How Many Acres?", acresf) #Changes datasets based on what city you choose on the frontend. #This expression is followed by two more else if statements. observeEvent(input$city, { if(input$city == "Apex") { framework_retype(apex) cityschools <-schoolsdf$features.properties %>% filter(ADDRCITY_1 == "Apex") assign("cityschools", cityschools, envir = .GlobalEnv) #Draw the map on click. observeEvent(input$submit, { output$map01 <- renderLeaflet({distanceFrom(input$address, input$footage, input$acres,tol = .15, input$dist) }) }) - Filter the data. The
distanceFromfunction above uses dplyr to filter the properties in the selected city by square footage, acreage, and distance from the subject property. Thetolargument is used to give a padding around square footage – few houses match exactly in that respect.#Filter once. houses_filtered <- houses %>% filter(Acres == acres)%>% filter(LvngAreaSF >= ((1-tol)*sqft)) %>% filter(LvngAreaSF <= ((1+tol)*sqft)) #This grabs lat & long from Google. getGeoInfo(subj_address) longitude_subj <- as.numeric(longitude) latitude_subj <- as.numeric(latitude) #Use the comparable house locations. xy <- houses_filtered[,1:2] xy <- as.matrix(xy) #Calculate distance. d <- spDistsN1(xy, c(longitude_subj, latitude_subj), longlat = TRUE) d <- d/1.60934 d <- substr(d, 0,4) #Filter again. distance <- houses_filtered %>% filter(distanceMi <= dist)
- Draw the map. The most important piece, the map, is drawn using Leaflet. I have the Schools layer hidden initially because it detracts from the main focus – the houses.
map <- leaflet() %>% addTiles(group = "Detailed") %>% addProviderTiles("CartoDB.Positron", group = "Simple") %>% addAwesomeMarkers(lng = longitude, lat = latitude, popup = subj_address, icon = awesomeIcons(icon='home', markerColor = 'red'), group = "Subject Property") %>% addAwesomeMarkers(lng = distance$X, lat = distance$Y, popup = paste(distance$Address,distance$`Sold Price`, distance$distanceMi, sep = ""), icon = awesomeIcons(icon = 'home', markerColor = 'blue'), group = "Comps")%>% addAwesomeMarkers(lng = schoolsdf$long, lat = schoolsdf$lat, icon = awesomeIcons(icon = 'graduation-cap',library = 'fa', markerColor = 'green', iconColor = '#FFFFFF'), popup = schoolsdf$features.properties$NAMELONG, group = "Schools")%>% addLayersControl( baseGroups = c("Simple", "Detailed"), overlayGroups = c("Subject Property", "Comps", "Schools"), options = layersControlOptions(collapsed = FALSE)) map <- map %>% hideGroup(group = "Schools") - Regression model. The second tab at the top of the page leads to more information input that is used in creating a predictive model for the subject property. The implementation is somewhat messy, so if you’d like to check it out, the code is at the bottom of
app.Rin the GitHub repo.
That’s it! It took a while to get all the pieces together, but I think the final product is useful and I learned a lot along the way. There are a few places I want to improve: simplify the re-typing sections, make elements refresh without clicking submit, among others. If you have any questions about the code please leave a comment or feel free to send me an email.
Happy coding,
Kiefer Smith

R-bloggers.com offers daily e-mail updates about R news and tutorials about learning R and many other topics. Click here if you're looking to post or find an R/data-science job.
Want to share your content on R-bloggers? click here if you have a blog, or here if you don't.