December 2016

PISA 2015 – how to read/process/plot the data with R

December 7, 2016 | smarterpoland

Yesterday OECD has published results and data from PISA 2015 study (Programme for International Student Assessment). It’s a very cool study – over 500 000 pupils (15-years old) are examined every 3 years. Raw data is publicly available and one can easily access detailed information about pupil’s academic performance and detailed data from ... [Read more...]

Breaking the Silence

December 7, 2016 | Jon Calder's R Blog

Reflections on new beginnings... - In April of 2016, I made a new friend. His name is Lorenz and he is from Switzerland. We met one evening when I arrived to pick him up for a small church group meeting, and he ambled up to the driver side door on...
[Read more...]

Breaking the Silence

December 7, 2016 | Jon Calder's R Blog

Reflections on new beginnings... - In April of 2016, I made a new friend. His name is Lorenz and he is from Switzerland. We met one evening when I arrived to pick him up for a small church group meeting, and he ambled up to the driver side door...
[Read more...]

Euler Problem 2: Even Fibonacci Numbers

December 7, 2016 | Peter Prevos

Solutions to Euler Problem 2 in the R language for statistical computing. This problem asks to sum even numbers in the Fibonacci sequence whose values do not exceed four million. Continue reading → The post Euler Problem 2: Even Fibonacci Numbers appeared first on The Devil is in the Data. [Read more...]

2016-15 Automating R Demonstration Videos

December 7, 2016 | pmur002

This document describes a proof-of-concept for producing R demonstration videos in a fully-automated manner. The “script” for the video consists of a text file containing code chunks paired with text commentary. The video is produced by running the code while recording a screen capture, using text-to-speech software to record audio ... [Read more...]

2016-15 Automating R Demonstration Videos

December 7, 2016 | pmur002

This document describes a proof-of-concept for producing R demonstration videos in a fully-automated manner. The “script” for the video consists of a text file containing code chunks paired with text commentary. The video is produced by running the code while … Continue reading → [Read more...]

Microsoft R Server 9.0 now available

December 7, 2016 | David Smith

Microsoft R Server 9.0, Microsoft's R distribution with added big-data, in-database, and integration capabilities, was released today and is now available for download to MSDN subscribers. This latest release is built on Microsoft R Open 3.3.2, and adds new machine-learning capabilities, new ways to integrate R into applications, and additional big-data support ... [Read more...]

November Package Picks

December 7, 2016 | Joseph Rickert

by Joseph Rickert November was a prolific month for R developers: 189 new packages landed in CRAN. I have selected more than a quarter of them for this post, but I haven’t listed everything that is worth a look. My November 2016 picks are organized into four categories: Biotech (4 picks), Data (6 ... [Read more...]

R-SQL Exercises

December 7, 2016 | Paritosh Gupta

How to write Structured Query Language (SQL) code in R. Well there are many packages on CRAN that relate to databases. In the exercises below we cover some of the important data manipulation operations using SQL in R. We will use a ‘sqldf’ package, an R package for running SQL ... [Read more...]

Secret Santa in R

December 7, 2016 | David Selby

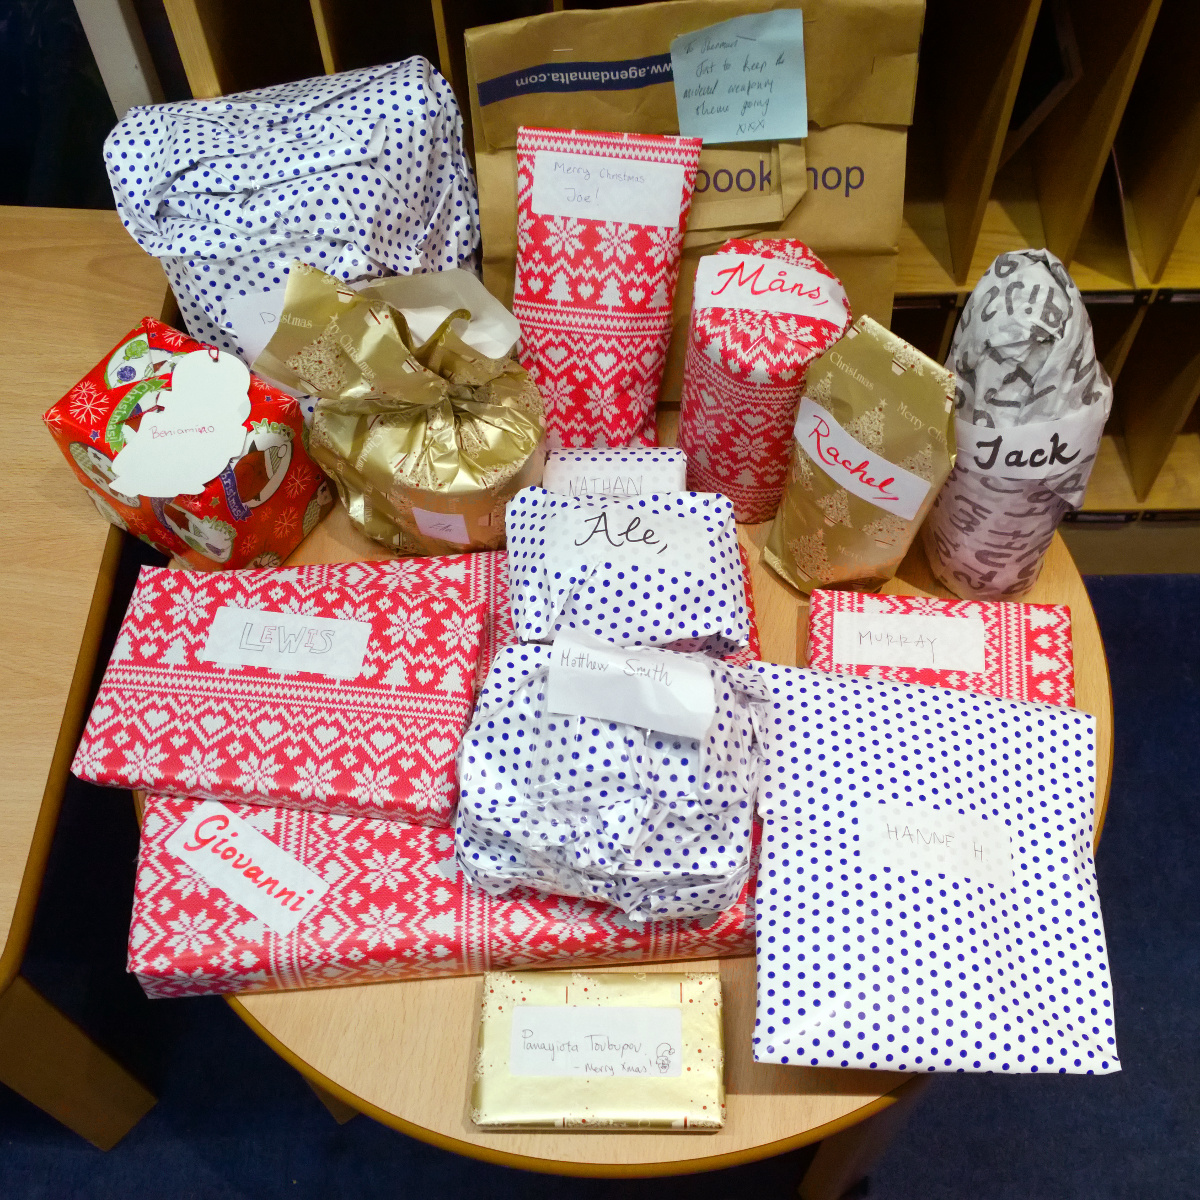
Our office just exchanged presents for Secret Santa, a tradition where each person is randomly assigned someone else to give an anonyous gift. One of the challenges of Secret Santa is keeping the pairs of gift-givers and receivers both random and secret. How can you do this while also taking ...
[Read more...]

Replicating CRSP Volatility Decile Portfolios in R

December 7, 2016 | Erol Biceroglu

  Introduction In this post, I provide R code that enables the replication of the Center for Research in Security Prices (CRSP) Volatiliy Deciles using Yahoo! Finance data. This post is related to my last blog post in that it will generate the CRSP low volatility decile portfolio, thereby facilitating the ...
[Read more...]

Secret Santa Picker 2 using R

December 7, 2016 | wszafranski

Last year I made a blog post about a Secret Santa picker HERE, but to use it required quite a bit of messing around with the code. So this year I decided to improve the whole thing by making it a function rather than a script. The function take two ... [Read more...]

Pipe Dream

December 7, 2016 | R-SquareD

Plusses and Arrows and Percents, oh my!. - Do you continually substitute “%__%” for “+” when switching between data wrangling and data visualization? I’ve got just the solution for you! Count myself as one of those ...
[Read more...]

Using replyr::let to Parameterize dplyr Expressions

December 6, 2016 | Nina Zumel

Imagine that in the course of your analysis, you regularly require summaries of numerical values. For some applications you want the mean of that quantity, plus/minus a standard deviation; for other applications you want the median, and perhaps an interval around the median based on the interquartile range (IQR). ...
[Read more...]

Announcing Riyadh R User Group

December 6, 2016 | Ali Arsalan Kazmi

Many data analysts in Riyadh (or as much as I have met) still valiantly use Excel and/or SQL to perform analyses. Some engage in SQL gymnastics for the simple operation of pivoting, whilst others wait for purchase of SAS licences, affirming that SAS ... [Read more...]

the incredible accuracy of Stirling’s approximation

December 6, 2016 | xi'an

The last riddle from the Riddler [last before The Election] summed up to find the probability of a Binomial B(2N,½) draw ending up at the very middle, N. Which is If one uses the standard Stirling approximation to the factorial function, log(N!)≈Nlog(N) – N + ½log(2πN) the ...
[Read more...]

Select and Query Exercise

December 6, 2016 | Hasan Imtiaz

In this exercise we cover the basics on selecting and extracting data using queries. We add a few other materials into it. This should prepare you for the next exercise: Basic Decision Tree. The purpose of this is to give you the 20 percent of the tools to get 80 percent of ... [Read more...]

scatterpie for plotting pies on ggplot

December 6, 2016 | R on Guangchuang Yu

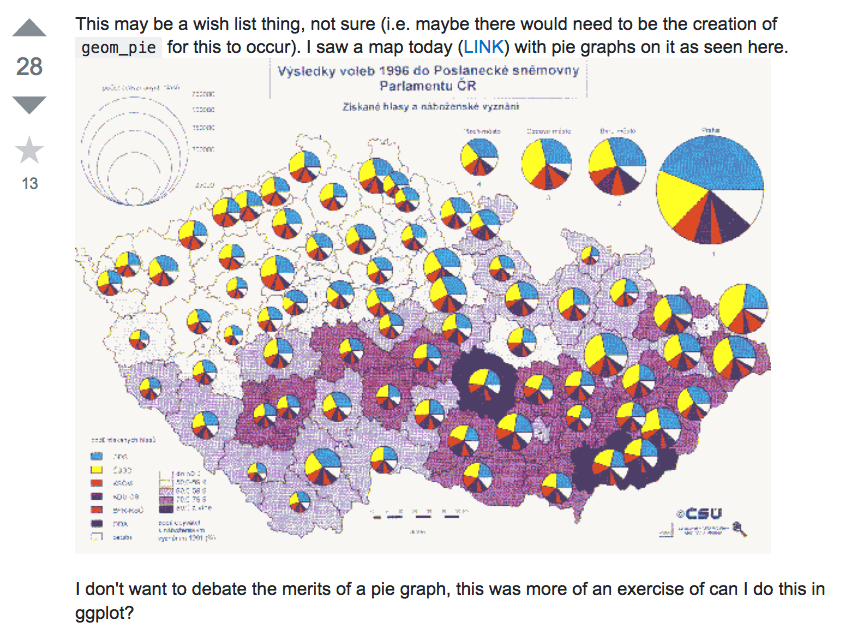
Plotting pies on ggplot/ggmap is not an easy task, as ggplot2 doesn’t provide native pie geom. The pie we produced in ggplot2 is actually a barplot transform to polar coordination. This make it difficult if we want to produce a map like the above screenshot, which was posted ...
[Read more...]
1 12 13 14 15 16 18

Never miss an update!
Subscribe to R-bloggers to receive
e-mails with the latest R posts.
(You will not see this message again.)

Click here to close (This popup will not appear again)