
Parallel Vectorized Operations
Want to share your content on R-bloggers? click here if you have a blog, or here if you don't.
After using R for a few years people come to realize how inefficient loops are (in all languages), even after pre-allocating memory. Then you begin to use the apply functions and revel at their speed. However, once you have datasets > 10-15 million the apply family can begin to creep along (relative to the amount of logic in your function). Luckily, most datasets I work with are between 1 – 5 million records and do not encounter performance issues too often. However, when we do run into large datasets we have our parallel packages.
Demo Machine
While writing this demo from my home laptop I was not seeing performance gains in parallel, because I was running out of RAM to maximize the efficiency of parallel processing. Therefore, I decided to checkout Google’s Cloud and was quite happy with the aesthetics and performance of their platform. Now, I do not work for Google, but it is worth checking out their trial.
custom (8 vCPUs, 32 GB memory)
For Loop
Most programmers know to try and avoid loops whenever possible because of they are extremely resource intensive. However, with languages such as R, the majority of the time spent is manipulating the dataset. Oftentimes this includes cleaning and feature engineering which requires user-defined functions. If you have less than 10,000 observations and the function is not overly complex then for loops are fine. The example below processes 150 observations in three hundredth of a second.
IrisClassifier  <- function(df,i){
  if(df[1][i,] >= 5.8 & df[4][i,] >= 1.8){
    return('virginica')
  }else if(df[1][i,] <= 5.7 & df[4][i,] <= 1){
    return('setosa')
  }else{
    return('versicolor')
  }
}
iris$Check <- ''
system.time(
  for(i in 1:nrow(iris)){
    iris$Check[i] <- IrisClassifier(iris,i)
  }
)
| User Time | System Time | Elapsed Time |
|---|---|---|
| 0.03 | 0.00 | 0.03 |
Vectorized Operations
How does the apply family speed up our functions? It converts a scalar (single item) process to a vector (array) process. Think of a mill having to cut lumber piece-by-piece or having one large saw and applying it to all of the lumber at once.
IrisClassifier  <- function(col1,col2){
  if(col1 >= 5.8 & col2 >= 1.8){
    return('virginica')
  }else if(col1 <= 5.7 & col2 <= 1){
    return('setosa')
  }else{
    return('versicolor')
  }
}

system.time(iris$Check <- mapply(psuedoClassifier,iris[,1],iris[,4]))
| User Time | System Time | Elapsed Time |
|---|---|---|
| 0.00 | 0.00 | 0.00 |
Loop vs. mapply
Required Libraries:
library(doSNOW)
library(foreach)
library(data.table)
library(sqldf)
library(ggplot2)
The Dataset
For this example we will be using a simple dataset starting with 1,000,000 million observations and increment by 1,000,000 to 30,000,000 million observations. The entire script is located at the end of this example.
df <-   df <- data.frame(a = round(rnorm(values[i],mean = 18,sd = 10),0),
                   b = round(rnorm(values[i],mean = 10,sd = 11),0),
                   c = round(rnorm(values[i],mean = 400,sd = 44),0),
                   d = round(rnorm(values[i],mean = 100,sd = 33),0),
                   e = round(rnorm(values[i],mean = 11,sd = 3),0),
                   f = round(rnorm(values[i],mean = 223,sd = 1000),0)
  )
Test Function
For this example we will use the mapply to show how to apply a function with multiple parameters. I find most articles online only demonstrating how to apply with one parameter so I used this as an excuse to demonstrate applying a function with multiple parameters.
unspirited.func <- function(a,b,c,d,e,f){
  if(a > 20 & b  300 & c  30 & log(c)> 6) {
    return('Fail - A')
  }else if(b > 38 & log(c)> 6) {
    return('Fail- B')
  }else if(d > 175 & log(c)> 6) {
    return('Fail - D')
  }else if(e > 18 & log(c)> 6) {
    return('Fail - E')
  }else if(f > 1989 & log(c)> 6) {
    return('Fail - F')
  }else{
    return('Unsure')
  }
}
Comparing For Loop to Vectorized Operations

| Type | Number of Observations | Elapsed Time |
|---|---|---|
| Loop | 50000 | 24.593 |
| mapply | 50000 | 0.536 |
| Loop | 100000 | 59.314 |
| mapply | 100000 | 1.228 |
| Loop | 150000 | 117.658 |
| mapply | 150000 | 1.865 |
| Loop | 200000 | 209.694 |
| mapply | 200000 | 2.658 |
| Loop | 250000 | 317.212 |
| mapply | 250000 | 3.283 |
| Loop | 300000 | 521.578 |
| mapply | 300000 | 3.816 |
| Loop | 350000 | 615.212 |
| mapply | 350000 | 4.625 |
| Loop | 400000 | 854.06 |
| mapply | 400000 | 5.571 |
| Loop | 450000 | 928.809 |
| mapply | 450000 | 6.437 |
| Loop | 500000 | 1210.446 |
| mapply | 500000 | 7.179 |
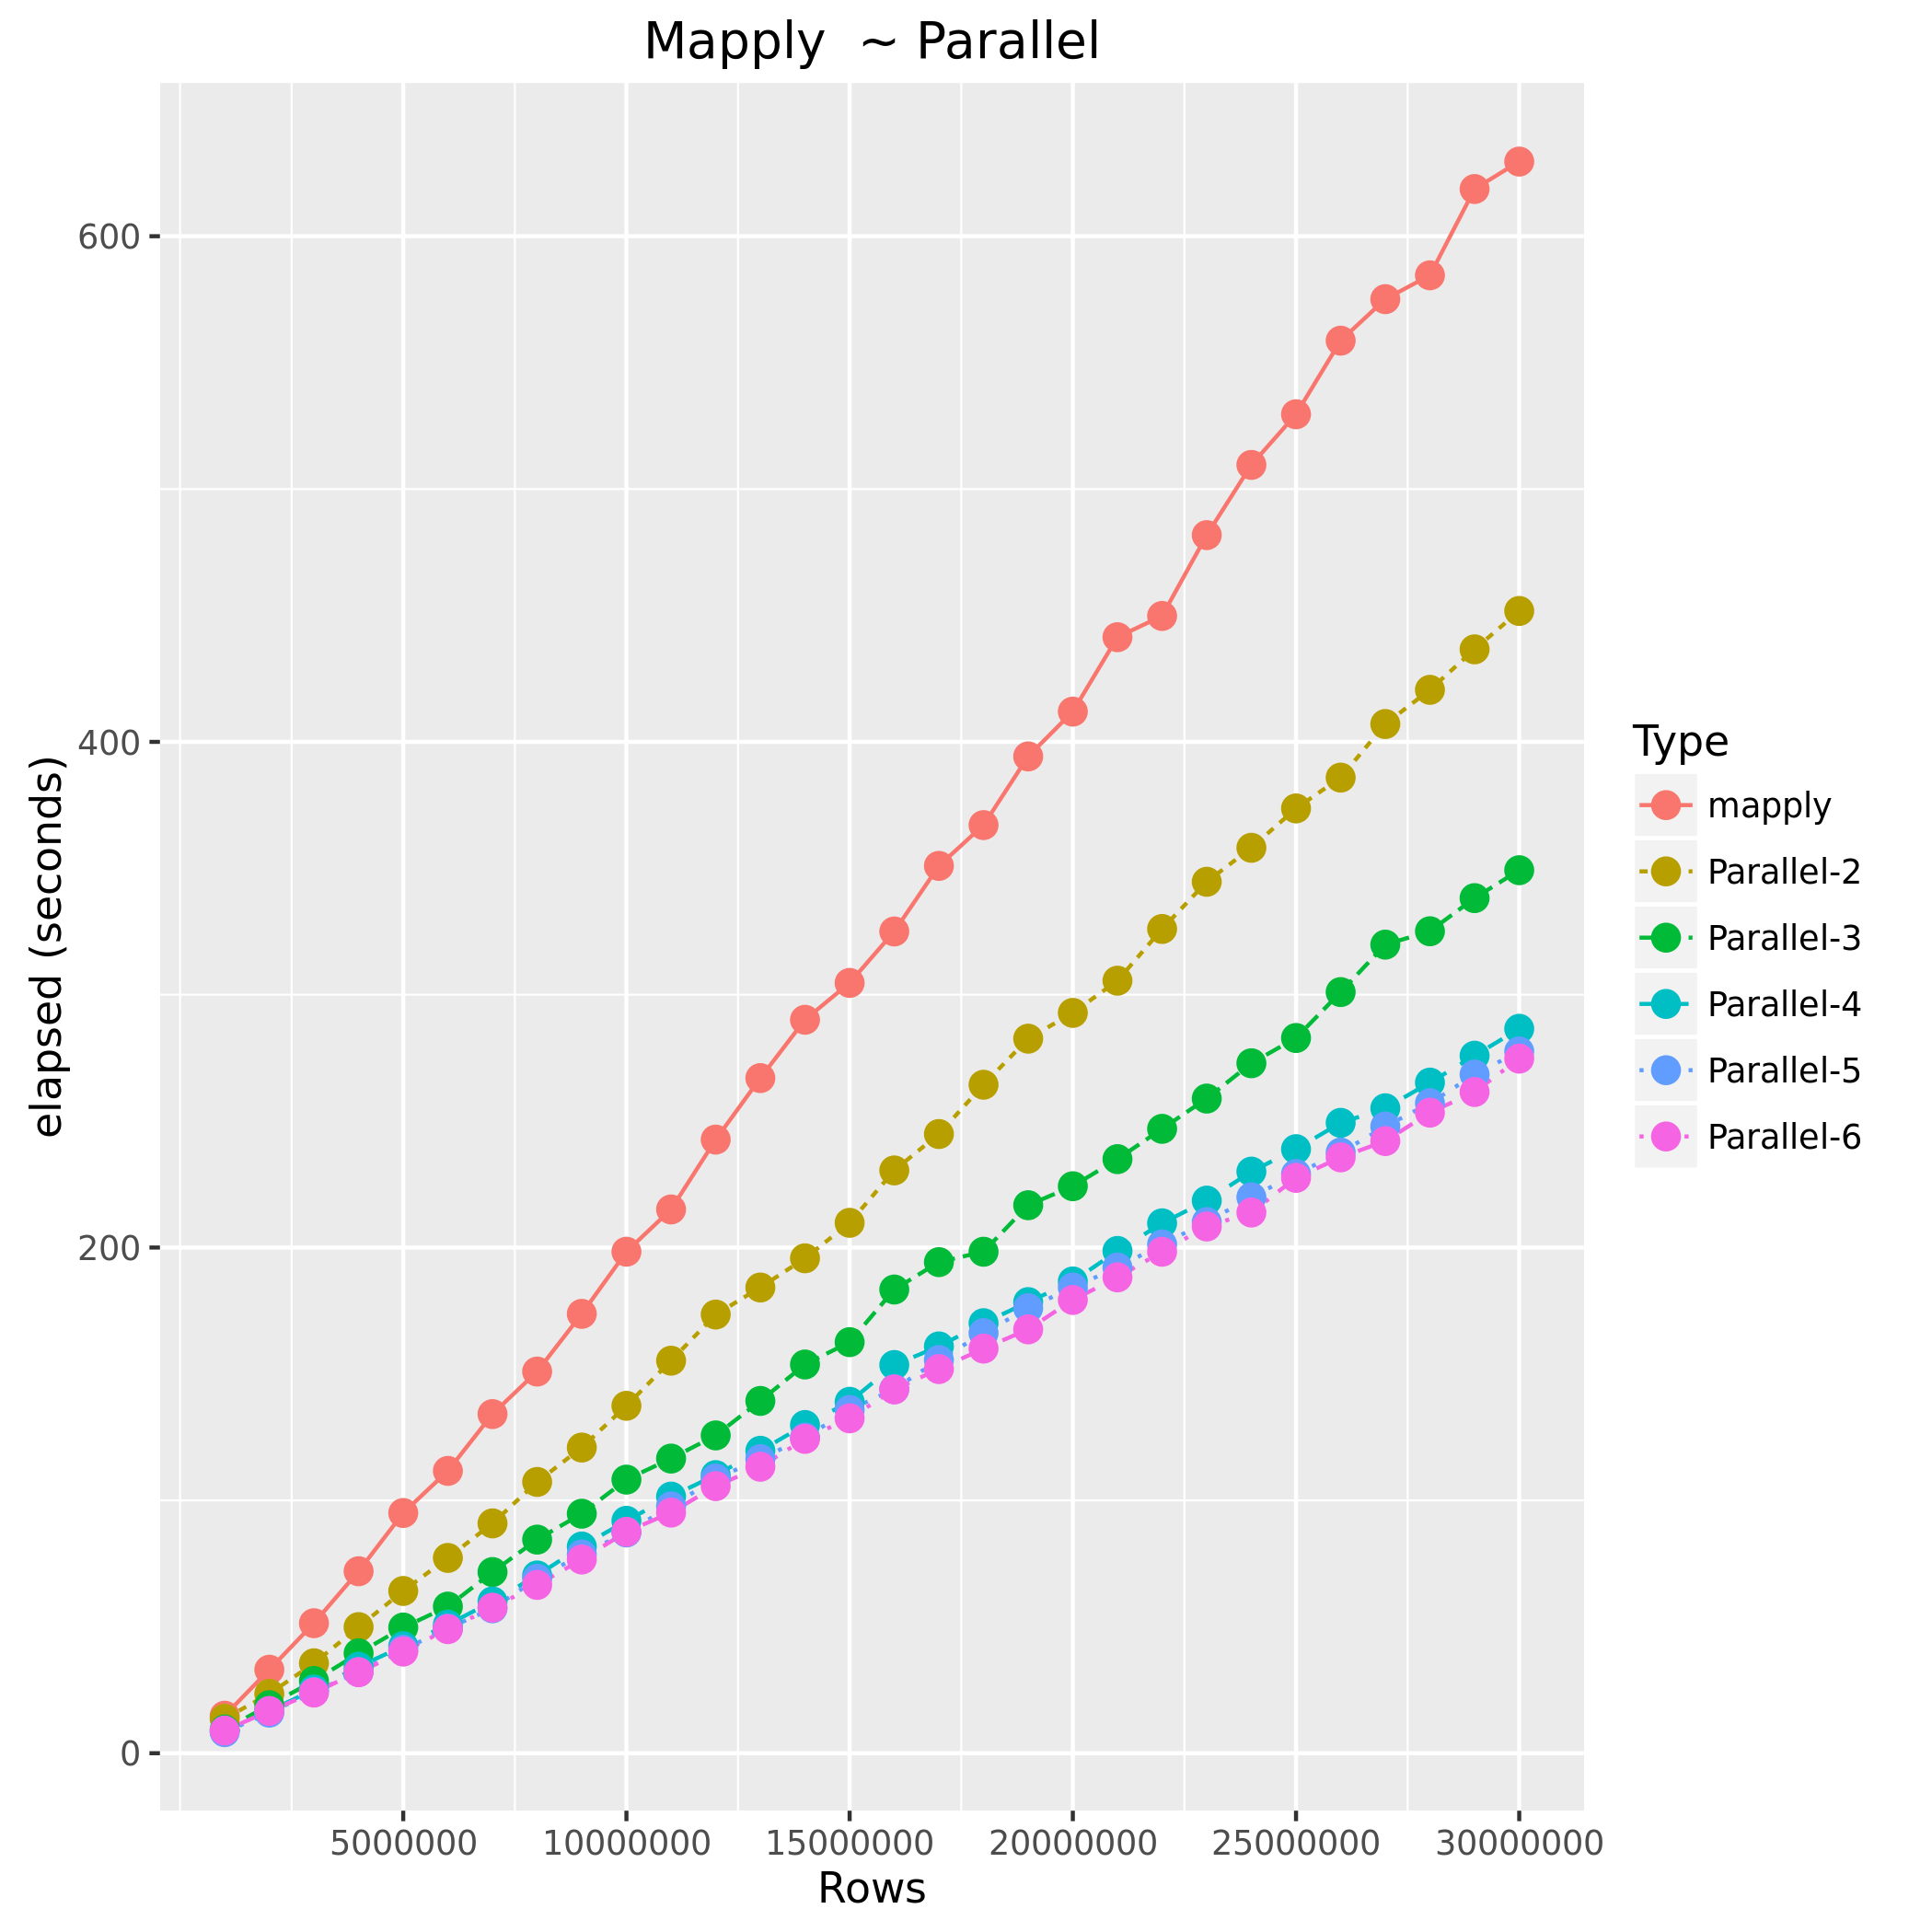
Mapply vs. Parallel Mapply
Parallel Operations
Luckily most current laptops, pcs, and cloud machines all offer multiple cores of processing power. Therefore, how does parallel processing work? Essentially, R starts up n number of instances and sends subsets of the original data to be processed in those instances using its own processing core, and then finally returning the results back together.
| Type | Number of Observations | Elapsed Time |
|---|---|---|
| mapply | 1000000 | 14.851 |
| Parallel-2 | 1000000 | 13.641 |
| Parallel-3 | 1000000 | 9.407 |
| Parallel-4 | 1000000 | 8.741 |
| Parallel-5 | 1000000 | 8.326 |
| Parallel-6 | 1000000 | 8.977 |
| mapply | 5000000 | 95.012 |
| Parallel-2 | 5000000 | 64.179 |
| Parallel-3 | 5000000 | 49.724 |
| Parallel-4 | 5000000 | 42.357 |
| Parallel-5 | 5000000 | 40.959 |
| Parallel-6 | 5000000 | 40.204 |
| mapply | 10000000 | 198.36 |
| Parallel-2 | 10000000 | 137.413 |
| Parallel-3 | 10000000 | 108.221 |
| Parallel-4 | 10000000 | 91.929 |
| Parallel-5 | 10000000 | 87.314 |
| Parallel-6 | 10000000 | 87.57 |
| mapply | 15000000 | 304.673 |
| Parallel-2 | 15000000 | 209.789 |
| Parallel-3 | 15000000 | 162.592 |
| Parallel-4 | 15000000 | 138.99 |
| Parallel-5 | 15000000 | 135.785 |
| Parallel-6 | 15000000 | 132.459 |
| mapply | 20000000 | 411.984 |
| Parallel-2 | 20000000 | 292.82 |
| Parallel-3 | 20000000 | 224.262 |
| Parallel-4 | 20000000 | 186.6 |
| Parallel-5 | 20000000 | 184.216 |
| Parallel-6 | 20000000 | 179.269 |
| mapply | 25000000 | 529.586 |
| Parallel-2 | 25000000 | 373.688 |
| Parallel-3 | 25000000 | 282.885 |
| Parallel-4 | 25000000 | 238.923 |
| Parallel-5 | 25000000 | 229.101 |
| Parallel-6 | 25000000 | 227.555 |
| Parallel-2 | 30000000 | 451.788 |
| Parallel-3 | 30000000 | 349.257 |
| Parallel-4 | 30000000 | 286.526 |
| Parallel-5 | 30000000 | 277.594 |
| Parallel-6 | 30000000 | 274.735 |
Considerations
- Required Setup time
- Parallel will end up using more RAM
- Shared server resources
Final Note
After hearing Max Kuhn speak a few years ago he said always check to see if someone has already written the function you are coding. After, writing this post I did stumble upon some builtin in parallel apply functions. However, I have not researched exactly how these operate.
The Entire Script
###############################################################################################################################
# Name             :  Parallel Process Example
# Date             :  2016-09-03
# Author           :  Christopher M
# Dept             :  Business Analytics
# Purpose          :  ~
###############################################################################################################################
# ver    user        date(YYYYMMDD)        change
# 1.0     ~          20160903              initial
###############################################################################################################################

library(parallel)
library(ggplot2)

## Display number of CPU cores on host
detectCores(all.tests = FALSE, logical = TRUE)

## Example function for processing
unspirited.func <- function(a,b,c,d,e,f){

  if(a > 20 & b  300 & c  30 & log(c)> 6) {
    return('Fail - A')
  }else if(b > 38 & log(c)> 6) {
    return('Fail- B')
  }else if(d > 175 & log(c)> 6) {
    return('Fail - D')
  }else if(e > 18 & log(c)> 6) {
    return('Fail - E')
  }else if(f > 1989 & log(c)> 6) {
    return('Fail - F')
  }else{
    return('Unsure')
  }

}

## kfold function to split data for parallel processing
kfold <- function(df,k){
  require(sqldf)
  if( length(which(colnames(df)=='folds'))>0){
    stop(print('Rename column(s) named folds'))
    break

  }
  #randomize the data
  df<-sqldf("SELECT * FROM df order by random()")

  #Create equally size folds
  df$folds <- cut(seq(1,nrow(df)),breaks=k,labels=FALSE)

  return(df)

}

## function for parallel processing
parallelApply <- function(df,cols,func,cores){

  require(doSNOW)
  require(foreach)
  require(data.table)
  cl <- makeCluster(cores, type="SOCK")
  registerDoSNOW(cl)

  ## Create ID to compute in parallel
  df <- kfold(df,cores)

  ## Process data in parallel
  system.time(NewDataFrame <- foreach(i = 1:cores) %dopar% {
    tmpdata <- subset(df, folds == i)
    mapply(func,tmpdata[,cols[1]],tmpdata[,cols[2]],tmpdata[,cols[3]],tmpdata[,cols[4]],tmpdata[,cols[5]],tmpdata[,cols[6]])

  })

  ## Bind data back into dataframe
  NewDataFrame <- rbindlist(Map(as.data.frame, NewDataFrame))
  colnames(NewDataFrame) <- c('ParRow')
  df <- cbind(df,NewDataFrame)
  stopCluster(cl)
  return(df)

}

## values for dataframe length
values <- seq(1e6,30e6,1e6)

capture <- data.frame()

for(i in 1:length(values)){
  print(paste("processing:",values[i],"rows. There are",length(values)-i,"iterations left to complete"))

  df <- data.frame(a = round(rnorm(values[i],mean = 18,sd = 10),0),
                   b = round(rnorm(values[i],mean = 10,sd = 11),0),
                   c = round(rnorm(values[i],mean = 400,sd = 44),0),
                   d = round(rnorm(values[i],mean = 100,sd = 33),0),
                   e = round(rnorm(values[i],mean = 11,sd = 3),0),
                   f = round(rnorm(values[i],mean = 223,sd = 1000),0)
  )
  ##______________________________________________________________________________
  ## Apply

  performance <- system.time(df$Check <- mapply(unspirited.func,df[,1],df[,2],df[,3],df[,4],df[,5],df[,6]))
  capture <- rbind(capture,data.frame(Type = 'mapply',Rows = values[i],elapsed = performance[3],PercentDifference = 1))
  df$Check <- NULL
  print('finished')
  print(capture)
  ##______________________________________________________________________________
  ## Parallel Apply
  base <- as.numeric(subset(capture,Rows == values[i] & Type == 'mapply')[3])
  for(x in 2:6){
    print(paste('running on',x,'cores'))
    performance <- system.time(df <- parallelApply(df,c(1,2,3,4,5,6),unspirited.func,x))
    capture <- rbind(capture,data.frame(Type = paste('Parallel-',x,sep=''),Rows = values[i],elapsed = performance[3],
                                        PercentDifference = abs(1-(performance[3]/base))))
    df$ParRow <- NULL
    df$folds <- NULL
  }
  gc()
  print(capture)
}
options(scipen=999)

## Example plots
ggplot(subset(capture,Type != 'Loop'),aes(Rows,elapsed,color = Type))+
  geom_line( aes(linetype=Type))+
  geom_point(size=3 )+
  ylab("elapsed (seconds)") +
  geom_text(data=subset(capture,Rows ==max(capture$Rows)),
            aes(label=Type))+
  ggtitle("Mapply  ~ Parallel")


tmp <- subset(capture,Type != 'mapply')
tmp$PercentDifference <- tmp$PercentDifference + 1
mapply <- subset(capture,Type == 'mapply')
capture_ <- rbind(tmp,mapply)

ggplot(subset(capture_,Type != 'Loop'),aes(Rows,PercentDifference,color = Type))+
  geom_line( aes(linetype=Type))+
  geom_point(size=3 )+
  ylab("Performance Increase") +
  ggtitle("Mapply  ~ Parallel") +
  scale_x_continuous(breaks = seq(5e6,30e6,5e6))+
  scale_y_continuous(breaks = seq(0,3,.1))
Related Post
- R Markdown: How to number and reference tables
- RDBL – manipulate data in-database with R code only
- R Markdown: How to format tables and figures in .docx files
- R Markdown: How to insert page breaks in a MS Word document
- Working on Data-Warehouse (SQL) with R
R-bloggers.com offers daily e-mail updates about R news and tutorials about learning R and many other topics. Click here if you're looking to post or find an R/data-science job.
Want to share your content on R-bloggers? click here if you have a blog, or here if you don't.