November 2016

sampling by exhaustion

November 24, 2016 | xi'an

The riddle set by The Riddler of last week sums up as follows: Within a population of size N, each individual in the population independently selects another individual. All individuals selected at least once are removed and the process iterates until one or zero individual is left. What is the ...
[Read more...]

Happy Thanksgiving! (2016)

November 24, 2016 | David Smith

It's Thanksgiving day here in the US, so we're taking the rest of the week off to reflect on what we're thankful for. And even if you're not in the US, today is a great day to send thanks to the R Core Group for providing their dedication, time, and ... [Read more...]

Converting between common reference electrodes

November 24, 2016 | R on chepec

Reference electrode potentials Standard hydrogen electrode Calomel electrode Silver-silver chloride electrode The absolute potential scale Notes Convert to or from any* electrode scale Plotting the dataset A very simple interactive demo Bibliography SessionInfo References A quickly put-together post on the relationships between common electrochemical reference electrode potentials and the vacuum ...
[Read more...]

Putting data on maps using R: easier than ever

November 23, 2016 | nsaunders

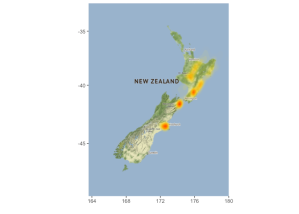
Using R to add data to maps has been pretty straightforward for a few years now. That said, it seems easier than ever to do things like use map APIs (e.g. Google, Open Street Map), overlay quite complex data visualisations (e.g. “heatmap-style” densities) and even generate animations. A ...
[Read more...]

R Phone Home: Notifications with pushoverr

November 23, 2016 | Brian Connelly

There are a lot of times when it would be great if your computer talked to you. pushoverr allows you to send yourself or your group notifications from R. Instead of compulsively checking the status of a running job, you can just have R tell you when it’s done, ... [Read more...]

October Package Picks

November 23, 2016 | Joseph Rickert

by Joseph Rickert In my August Package Picks post, I explained that my selection criteria favor packages with vignettes. (I find skimming through a package’s vignettes to be an effective method of “grokking” what a package is all about.) I also questioned why a person would go to all ... [Read more...]

Declining sea ice in the Arctic

November 23, 2016 | Peter's stats stuff - R

A number of data visualisations are circulating showing the disturbing rise in temperature at the North Pole and drop in coverage of Arctic sea ice. The current level of interest is credited to a tweet from Zack Labe, whose Twitter page is a great sou... [Read more...]

Monty Python generator

November 22, 2016 | xi'an

By some piece of luck I came across a paper by the late George Marsaglia, genial contributor to the field of simulation, and Wai Wan Tang, entitled The Monty Python method for generating random variables. As shown by the below illustration, the concept is to flip the piece H outside ...
[Read more...]

Calculating AUC: the area under a ROC Curve

November 22, 2016 | Guest Blogger

by Bob Horton, Microsoft Senior Data Scientist Receiver Operating Characteristic (ROC) curves are a popular way to visualize the tradeoffs between sensitivitiy and specificity in a binary classifier. In an earlier post, I described a simple “turtle’s eye view” of these plots: a classifier is used to sort cases ... [Read more...]

Reading data from google sheets into R

November 22, 2016 | biomickwatson

Reading data from google sheets into R is something you imagine should be really simple, but often is anything but. However, package googlesheets goes a long way to solving this problem. Let’s crack on with an example. First, install the software: install.packages("googlesheets") We then need an example ... [Read more...]
1 2 3 4 5 6 15

Never miss an update!
Subscribe to R-bloggers to receive
e-mails with the latest R posts.
(You will not see this message again.)

Click here to close (This popup will not appear again)