
Tracking Precipitation by Day-of-Year
Want to share your content on R-bloggers? click here if you have a blog, or here if you don't.
Plotting cumulative day-of-year precipitation can helpful in assessing how the current year’s rainfall compares with long term averages. This plot shows the cumulative rainfall by day-of-year for Philadelphia International Airports rain gauge.
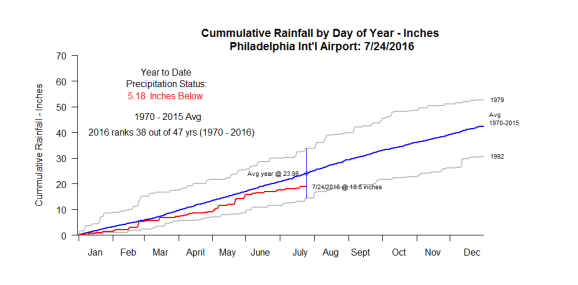
The source data was downloaded from the Pa Climatologist website for the period 1949:2016. The period 1970 – 2016 was used for the analysis because the data archive does not include January data for 1950 – 1969.
The blue line represents the average day-of-year cumulative rainfall while the minimum and maximum years are shown in grey. The current year, 2016, is shown in red. As of July 24, there was a 5.18 inch negative anomaly in rainfall at the station.
This chart was created in R using base graphics commands.

R-bloggers.com offers daily e-mail updates about R news and tutorials about learning R and many other topics. Click here if you're looking to post or find an R/data-science job.
Want to share your content on R-bloggers? click here if you have a blog, or here if you don't.