April 2016

Calculating Average Consumption From One Week of Purchases

April 14, 2016 | Francis Smart

A number of large surveys have attempted to quantify consumer consumption from a limited period of time observed. This task can be fairly complex as it is fraught with potentially large difficulties directly observing who is consuming what. Rather than this expensive method some researchers have attempted to substitute more ...
[Read more...]

Calculating Average Consumption From One Week of Purchases

April 14, 2016 | Francis Smart

A number of large surveys have attempted to quantify consumer consumption from a limited period of time observed. This task can be fairly complex as it is fraught with potentially large difficulties directly observing who is consuming what. Rather than this expensive method some researchers have attempted to substitute more ...
[Read more...]

Get Involved with the R Consortium

April 14, 2016 | Joseph Rickert

by Joseph Rickert The R Consortium, the non-profit trade organization formed under the Linux Foundation to support the R language and the R Community, is beginning to build real momentum. First of all, two new companies recently joined the Consortium: Avant which provides online personal and auto loans and Procogia, ... [Read more...]

Simpler isn’t always faster

April 14, 2016 | Jonathan Carroll

My name is Jonathan, and I have a coding obsession. I'll admit it, the Hadleyverse has ruined me. I can no longer read a blog post or stackoverflow question in base R and leave it be. There are improvements to...Continue Reading →
[Read more...]

d3/R Streamgraph on White House Petition Data

April 14, 2016 | data_steve

After last week’s post with the d3-htmlwidget chordplot showing the network of petition categories, in this post I decided to show the time trend aspect of how the petitions came in. I’m using @hrbrmstr’s htmlwidgets wrapper of a d3 streamgraph to help visualize the macro- and ... [Read more...]

Merging Dataframes Exercises

April 14, 2016 | John Akwei

When combining separate dataframes, (in the R programming language), into a single dataframe, using the cbind() function usually requires use of the “Match()” function. To simulate the database joining functionality in SQL, the “Merge()” function in R accomplishes dataframe merging with the following protocols; “Inner Join” where the left table ... [Read more...]

52Vis Week #3 – Waste Not, Want Not

April 13, 2016 | hrbrmstr

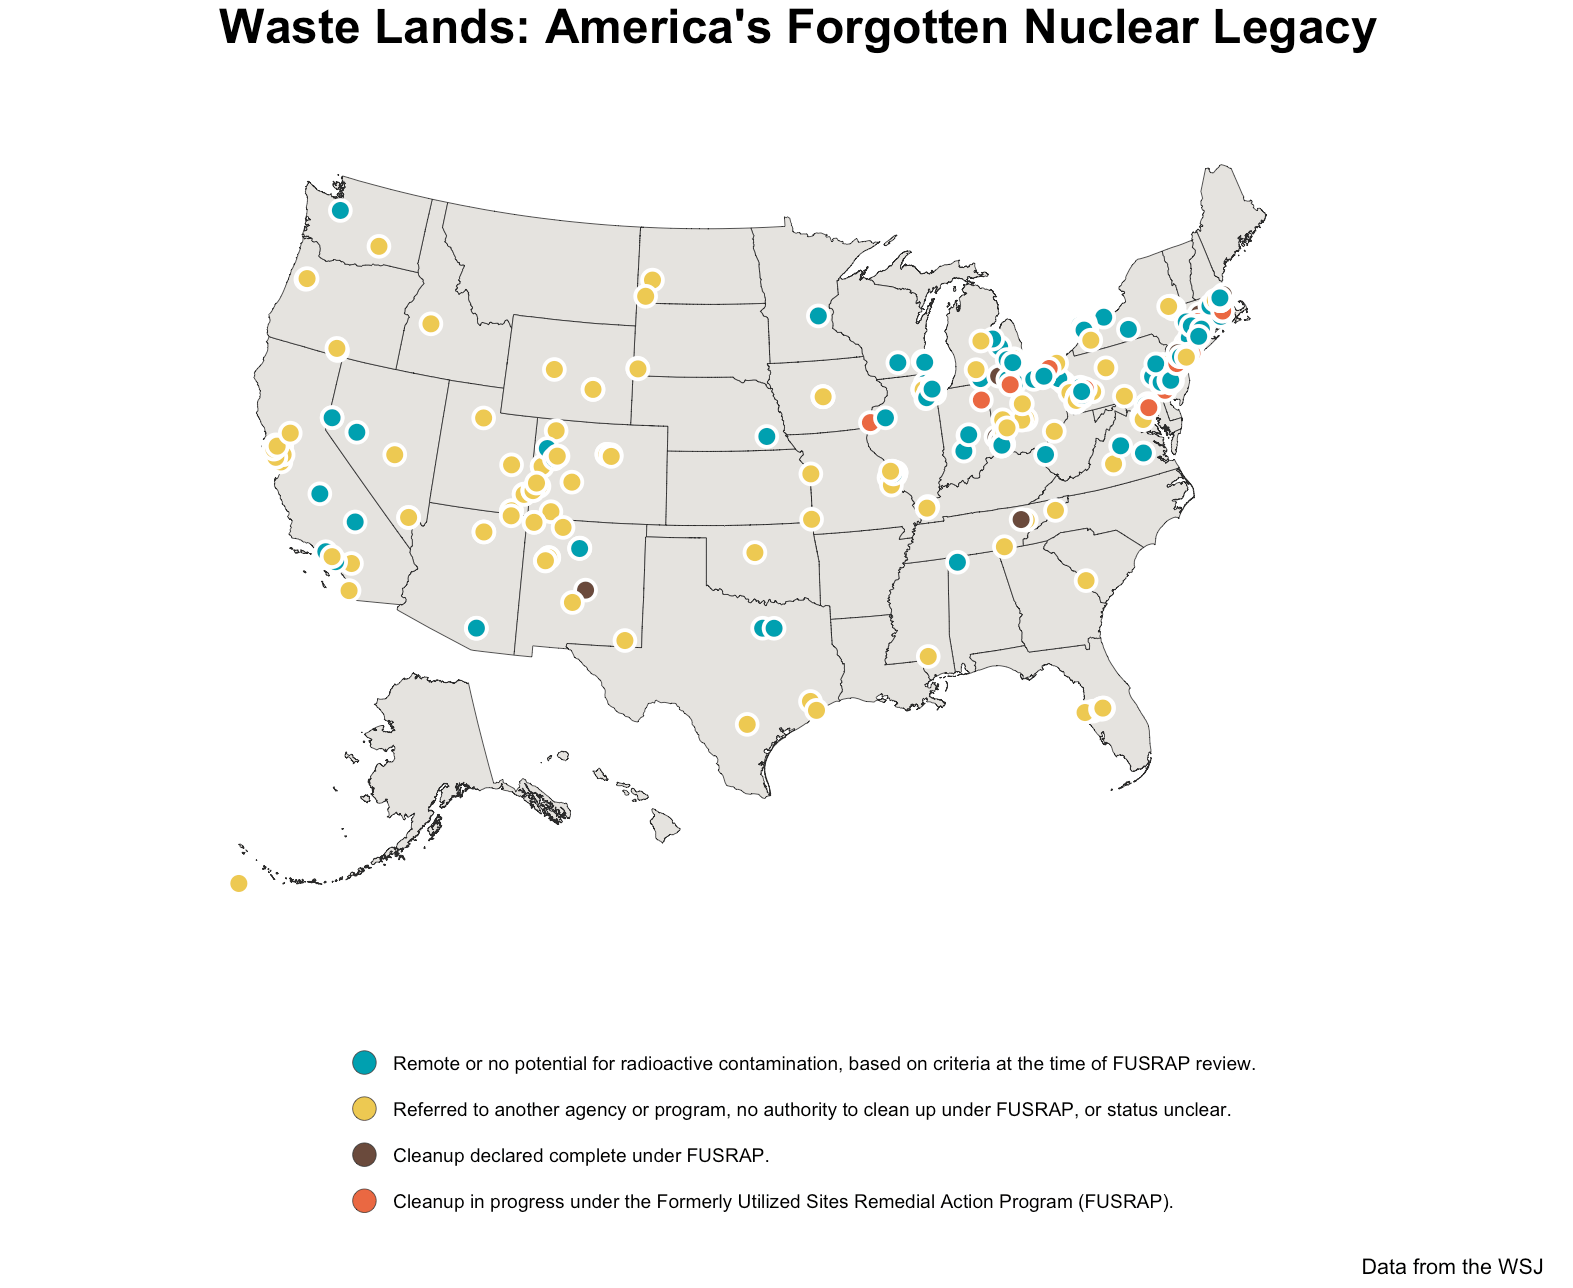
The Wall Street Journal did a project piece a while back in the “Waste Lands: America’s Forgotten Nuclear Legacy”. They dug through Department of Energy and CDC data to provide an overview of the lingering residue of this toxic time in America’s past (somehow, I have to believe ...
[Read more...]

52 Vis Week #2 Wrap Up

April 13, 2016 | hrbrmstr

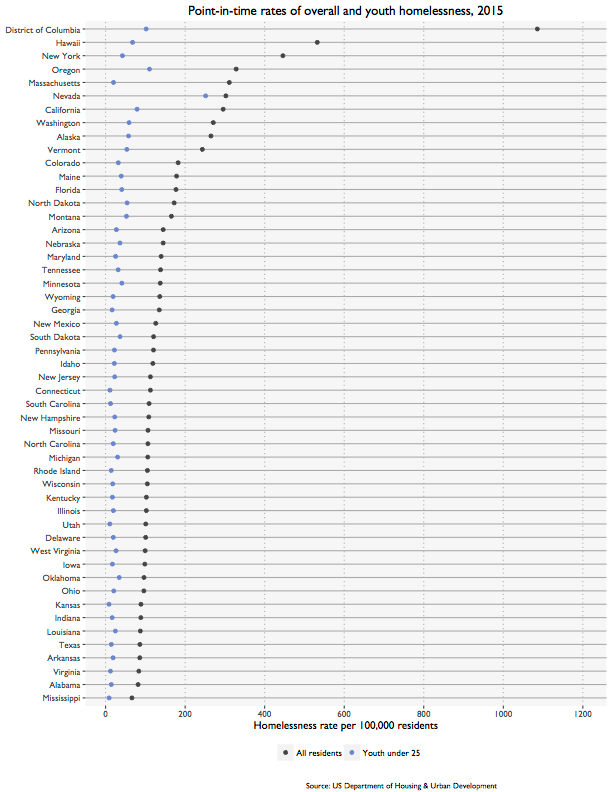
I’ve been staring at this homeless data set for a few weeks now since I’m using it both here and in the data science class I’m teaching. It’s been one of the most mindful data sets I’ve worked with in a while. Even when reduced ...
[Read more...]

52 Vis Week 1 Winners!

April 13, 2016 | hrbrmstr

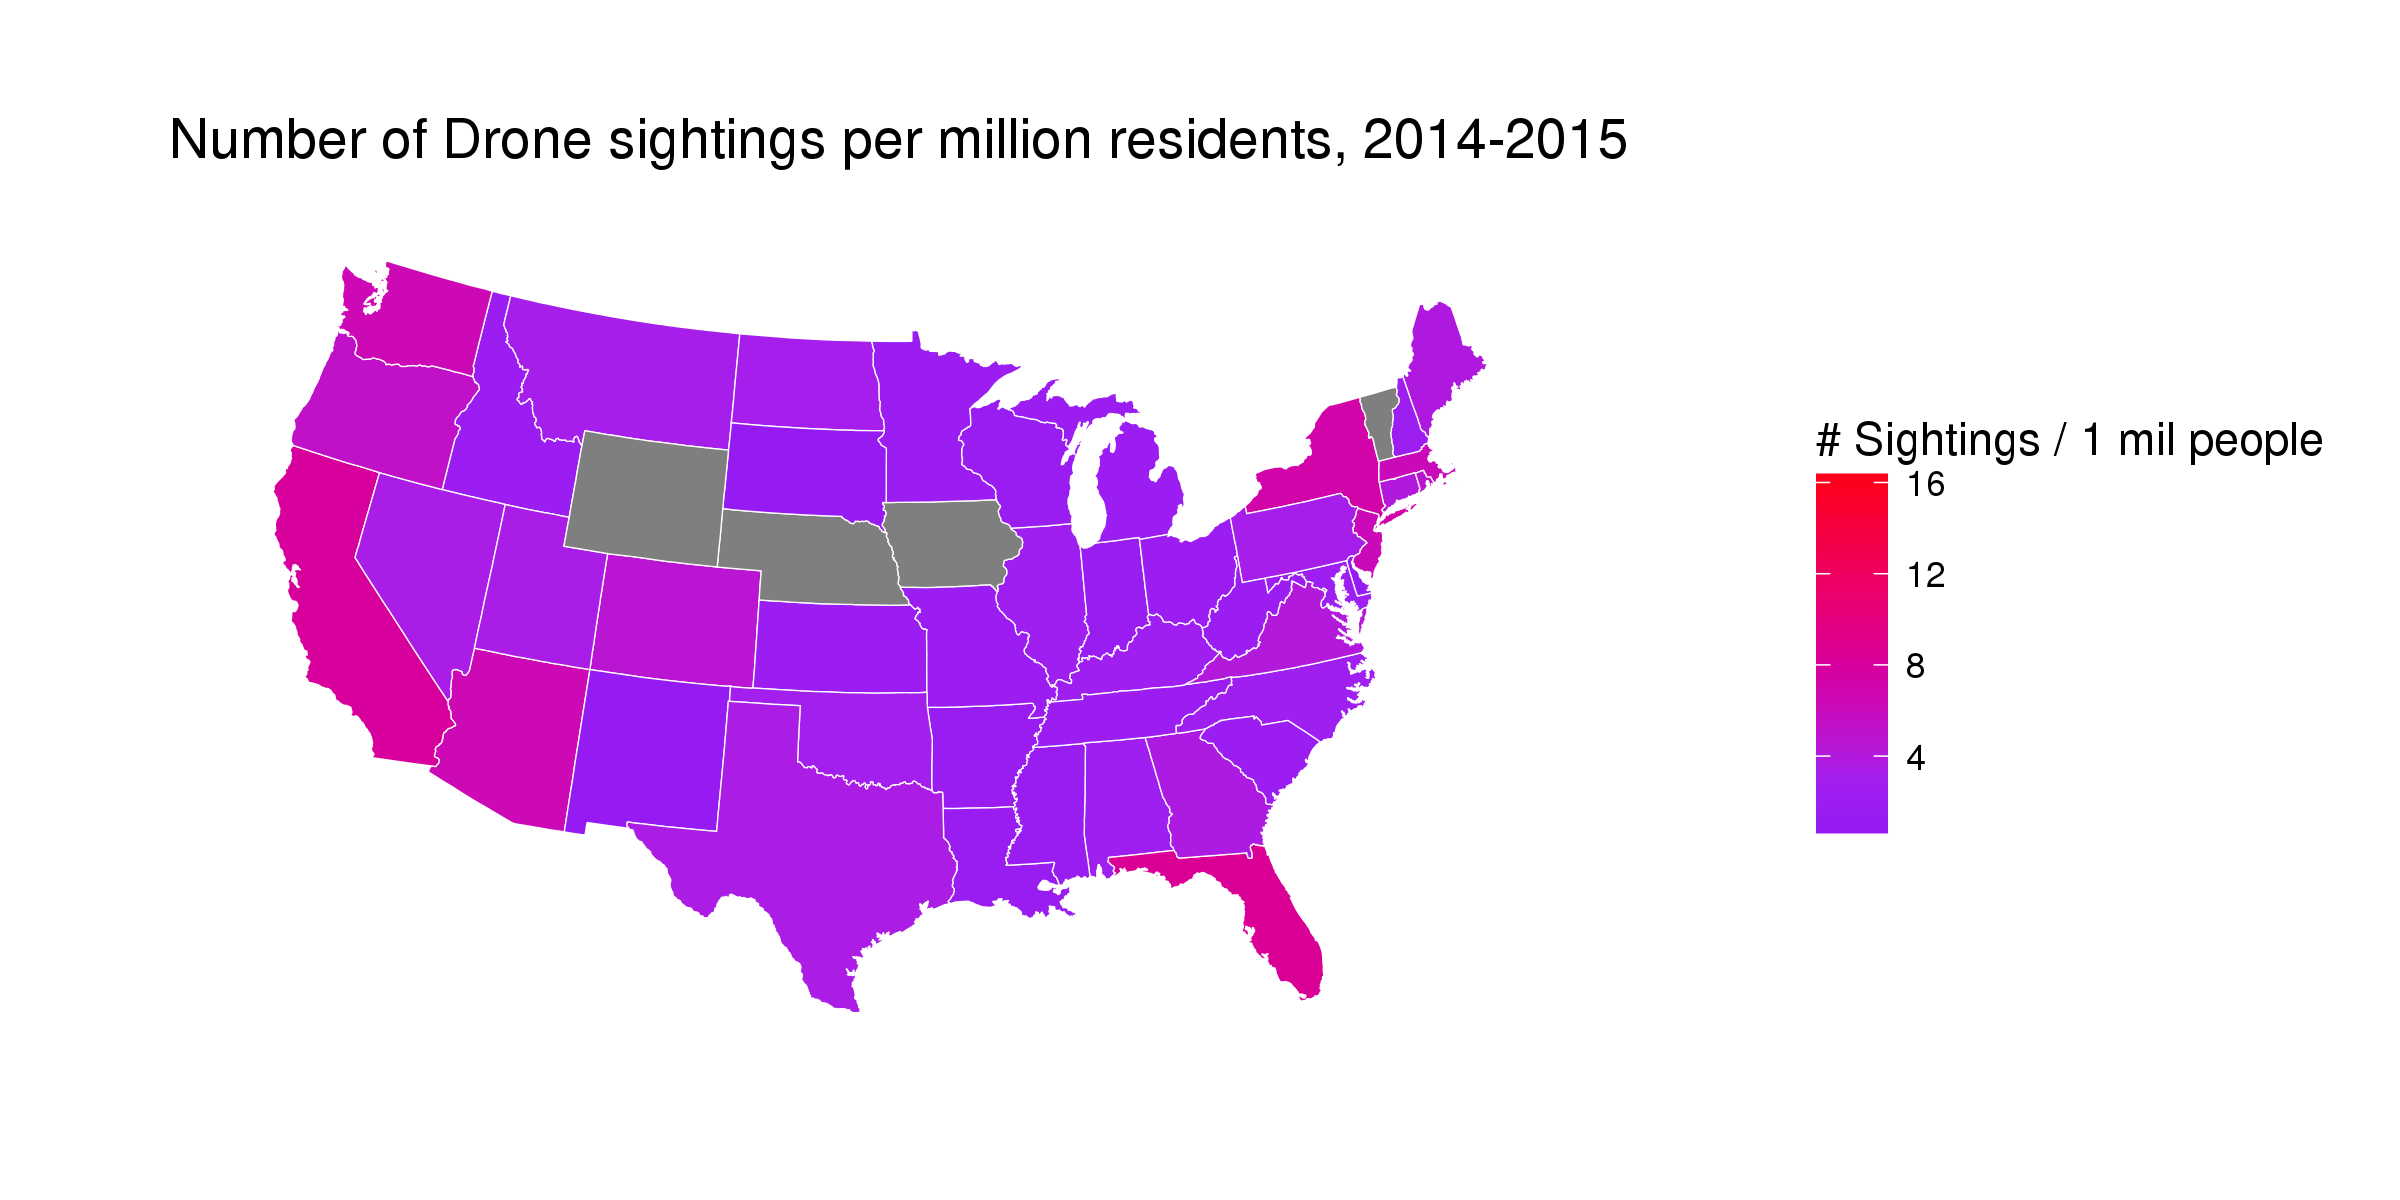
The response to 52Vis has exceeded expectations and there have been great entries for both weeks. It’s time to award some prizes! Week 1 – Send in the Drones I’ll take this week in comment submission order (remember, the rules changed to submission via PR in Week 2). NOTE: WordPress seems ...
[Read more...]

How to sort a list of dataframes

April 13, 2016 | Michy Alice

A method to gather data from different sources, sort them and keep a reference to the origin of each subset, plus some efficiency considerations The post How to sort a list of dataframes appeared first on MilanoR. [Read more...]

Microsoft Data Science VM now available as a Linux instance

April 13, 2016 | David Smith

Microsoft's Linux Data Science Virtual Machine is now available for use on the Azure Marketplace. Like the Windows-based instance of the Data Science VM, this pre-built system based on Linux CentOS 7.2 includes all the tools you'll need to analyze data, including Microsoft R Open, Anaconda Python, Jupyter Notebooks and a ... [Read more...]

Learn R By Intensive Practice – Part 2

April 13, 2016 | Selva Prabhakaran

This is a continuation of part 1 of the Learn R By Intensive Practice Series. In this part, we step up the game and learn a number of key concepts such as lists, sampling, data frames etc. At the end of each video, you will be solving a practice challenge based ...
[Read more...]

KEGG Module Enrichment Analysis

April 13, 2016 | R on Guangchuang Yu

KEGG MODULE is a collection of manually defined functional units, called KEGG modules and identified by the M numbers, used for annotation and biological interpretation of sequenced genomes. There are four types of KEGG modules: pathway modules – representing tight functional units in KEGG metabolic pathway maps, such as M00002 (Glycolysis, ... [Read more...]

Desktop DeployR

April 13, 2016 | Lee Pang

I'm going to be giving a talk this Thursday at my local R/Data Science Meetupabout my method for deploying self contained desktop R applications. Since my original post on the subject (over 2 years ago!) I've made manyof improvements thanks to the many useful comments I received and my own "... [Read more...]

Melbourne Data Science Initiative 2016

April 12, 2016 | R on Rob J Hyndman

In just over three weeks, the inaugural MeDaScIn event will take place. This is an initiative to grow the talent pool of local data scientists and to promote Melbourne as a world city of excellence in Data Science. The main event takes place on Friday 6th May, with lots of ... [Read more...]
1 5 6 7 8 9 13

Never miss an update!
Subscribe to R-bloggers to receive
e-mails with the latest R posts.
(You will not see this message again.)

Click here to close (This popup will not appear again)