[social4i size=”large” align=”float-right”]
Guest post by Amit Thombre. (you can email Amit with questions)Introduction: – George Box and David Cox developed a procedure to identify an appropriate exponent (lambda) to transform the data to improve its normality. The Lambda value indicates the power to which all data should be raised. For this, the Box-Cox power transformation searches for various values of lambda by various methods until the best value is found.
The current study was carried out to find which method of calculating lambda is beneficial for forecasting. There are 2 methods for calculating lambda, the “guerrero” and “loglik” method (reference is the BoxCox.lambda function in the forecast package). In Guerrero’s (1993) method lambda minimizes the coefficient of variation for subseries of data. In the “loglik” method, the value of lambda is chosen to maximize the profile log likelihood of a linear model fitted to data. The experiments were performed on 999 records out of 1001 records of the dataset of M1 competition (https://forecasters.org/resources/time-series-data/m-competition/). The normality of the data was checked by the Anderson-Darling test (nortest package).
Initially using the “guerrero” method for Box-Cox, the lambda was obtained. This lambda was used in the ARIMA technique for forecasting. The results showed that there are 468 records out of 999(46.85%) which have the RMSE of the forecasted results lower (when lambda using the guerrero method is used) than the RMSE of the forecasted results when no lambda is used. Using lambda (guerrero method) 153 records (out of 999 records) were obtained as normal data which were not initially normal. For example Figure 1 shows one of the time series data before and after the transformation. The right figure which is after transformation looks more like the normal distribution than the left figure which is without the transformation. Out of 153, 81 records showed lower RMSE of the forecasted results when lambda was used as compared to the RMSE when no lambda was used.
Figure 1. Frequency distribution of Time series before(left figure) and after(right figure) use of Box-Cox transformation.
In the next experiment the lambda was obtained using the “loglik” method of Box-Cox. This lambda was used in the ARIMA technique for forecasting. The results showed that there are 435 records out of 999(43.54%) which have the RMSE of the forecasted results lower (when lambda using the loglik method is used) than the RMSE when no lambda is used. Using lambda (log like method) 198 records (out of 999 records) were obtained as normal data which were not initially normal. Out of 198, 96 records showed lower RMSE of the forecasted results when lambda was used as compared to the RMSE when no lambda was used.
From the above data it is seen that “guerreo” method gives good values of lambda as compared to the “loglik” method, which help in better forecasting results.
References
Guerrero, V.M. (1993) Time-series analysis supported by power transformations. Journal of Forecasting, 12, 37–48.
Appendix
Lambda:- Box-Cox transformation parameter
RMSE:- Root mean square error
ARIMA: – Autoregressive integrated moving average model.
The data: MC1001
The code for this study is the following:
errf<-function(act, res)
{
  diff<-0
  s<-0
  j<-1
  k<-0
  # loop for iterating to each value of the actual value and finding the difference with thepredicted value
  for (mn in 1:length(act))
  {

    cat("Value of mn in err", mn)
    cat("Value of j in err", j)
    cat("Value of res[j] in err", res[j,])
    if ((is.na(act[mn])==FALSE)&(is.na(res[j,])==FALSE))
    {
      k<-k+1
      diff<-(act[mn]-res[j,])
      print(act[mn])
      print(res[j,])
      print(diff)
      s<-s+(diff*diff)
    }

    j<-j+1
  }
  cat("Value of k", k)
  er1<-sqrt(s/k) #forecasting error
  print(er1)
  return(er1)

}
#--------------------------------------------------------------------------------------
# code without use of transformation parameter
library('forecast')
library('timeSeries')
library('xts')
library('nortest')
if(!exists("d4")) d4<-read.csv("http://www.r-bloggers.com/wp-content/uploads/2016/02/MC1001.csv", header=FALSE)
errtest2<-0
skewdata<-0
kurtdata<-0
adrdata<-0
adrpval<-0
fname<-0
fr<-0
tsize<-0
lda<-0
indus<-0
for (nf in 1:nrow(d4))
{
  model<-0
  l<-0
  cat("Nth row", nf, nrow(d4))
  write(nf, "d:/ml/MOO/per12.txt")
  write(nrow(d4), "d:/ml/MOO/per12mod.txt")
  l1<-length(which(is.na(d4[nf,])==FALSE))


  d<-data.frame(t(d4[nf,8:l1]))
  freq=d4[nf,3]
  testsize1=d4[nf,4]
  st=1975
  month=4
  trsize<-nrow(d)-testsize1# the index cooresponding to training size.
  act1<-d[1:trsize,1]
  act2<-d[(trsize+1):nrow(d),1]
  tsa<-ts(d[1:trsize,1], frequency=freq, start=c(st,month))  # store the data in tsa as  the time series
  #l=BoxCox.lambda(d[,1],method=c("loglik"),lower=-5, upper=5)
  #tsa1<-BoxCox(d[,1], lambda=l)
  #skewdata[nf]<-skewness(tsa1)
  #kurtdata[nf]<-kurtosis(tsa1)
  skewdata[nf]<-skewness(d[,1])
  kurtdata[nf]<-kurtosis(d[,1])
  adr<-ad.test(d[,1])
  #try({adr<-ad.test(tsa1)})
  if(length(adr)>0)
  {
    adrdata<!-- Ultimate Nofollow Plugin | shortcode insertion failed | given href resource not valid, href must begin with:  --><-adr[[1]]
    adrpval[nf]<-adr[[2]]
  } else {
    adrdata[nf]<-NA
    adrpval[nf]<-NA
  }
  cat("\n  value of lambda", l)
  try({
    #model<-auto.arima(tsa, lambda=l)
    model<-auto.arima(tsa)
  })
  cat("\n Length(model)", length(model), nf)
  if(length(model)>1)
  {
    if(is.finite(model[[5]])==TRUE)
    {
      #resf4<- forecast(model,h=testsize1, lambda=l) # for getting the error
      resf4<- forecast(model,h=testsize1) # for getting the error
      resf4<-data.frame(resf4$mean)
      errtest2[nf]<-errf(act2,resf4)
    } else {
      errtest2[nf]<-NA
    }
  } else {
    errtest2[nf]<-NA
  }
  fname[nf]<-as.character(d4[nf,1])
  fr[nf]<-d4[nf,3]
  tsize[nf]<-d4[nf,4]
  lda[nf]<-l
  indus[nf]<-as.character(d4[nf,7])

} # for loop closure for number of files
res<-data.frame(fname,fr,tsize,indus,lda, errtest2, skewdata, kurtdata, adrdata, adrpval)
write.csv(res,"d:/ml/MOO/lambda.csv")
#--------------------------------------------------------------------------------------
# code with use of transformation parameter
if(!exists("d4")) d4<-read.csv("http://www.r-bloggers.com/wp-content/uploads/2016/02/MC1001.csv", header=FALSE)
errtest2<-0
skewdata<-0
kurtdata<-0
adrdata<-0
adrpval<-0
fname<-0
fr<-0
tsize<-0
lda<-0
indus<-0
for (nf in 1:nrow(d4))
{
  model<-0
  l<-0
  cat("Nth row", nf, nrow(d4))
  write(nf, "d:/ml/MOO/per12.txt")
  write(nrow(d4), "d:/ml/MOO/per12mod.txt")
  l1<-length(which(is.na(d4[nf,])==FALSE))
  d<-data.frame(t(d4[nf,8:l1]))
  freq=d4[nf,3]
  testsize1=d4[nf,4]
  st=1975
  month=4
  trsize<-nrow(d)-testsize1# the index cooresponding to training size.
  act1<-d[1:trsize,1]
  act2<-d[(trsize+1):nrow(d),1]
  tsa<-ts(d[1:trsize,1], frequency=freq, start=c(st,month))  # store the data in tsa as  the time series
  l=BoxCox.lambda(d[,1],method=c("guerrero"),lower=-5, upper=5)
  tsa1<-BoxCox(d[,1], lambda=l)
  skewdata[nf]<-skewness(tsa1)
  kurtdata[nf]<-kurtosis(tsa1)
  #skewdata[nf]<-skewness(d[,1])
  #kurtdata[nf]<-kurtosis(d[,1])

  #adr<-ad.test(d[,1])
  try({adr<-ad.test(tsa1)})
  if(length(adr)>0)
  {
    adrdata<!-- Ultimate Nofollow Plugin | shortcode insertion failed | given href resource not valid, href must begin with:  --><-adr[[1]]
    adrpval[nf]<-adr[[2]]
  } else {
    adrdata[nf]<-NA
    adrpval[nf]<-NA
  }
  cat("\n  value of lambda", l)
  try({
    model<-auto.arima(tsa, lambda=l)
    #model<-auto.arima(tsa)
  })
  cat("\n Length(model)", length(model), nf)
  if(length(model)>1)
  {
    if(is.finite(model[[5]])==TRUE)
    {
      resf4<- forecast(model,h=testsize1, lambda=l) # for getting the error
      #resf4<- forecast(model,h=testsize1) # for getting the error
      resf4<-data.frame(resf4$mean)
      errtest2[nf]<-errf(act2,resf4)


    } else {
      errtest2[nf]<-NA
    }
  } else {
    errtest2[nf]<-NA
  }
  fname[nf]<-as.character(d4[nf,1])
  fr[nf]<-d4[nf,3]
  tsize[nf]<-d4[nf,4]
  lda[nf]<-l
  indus[nf]<-as.character(d4[nf,7])
} # for loop closure for number of files
res<-data.frame(fname,fr,tsize,indus,lda, errtest2, skewdata, kurtdata, adrdata, adrpval)
write.csv(res,"lambda2.csv")


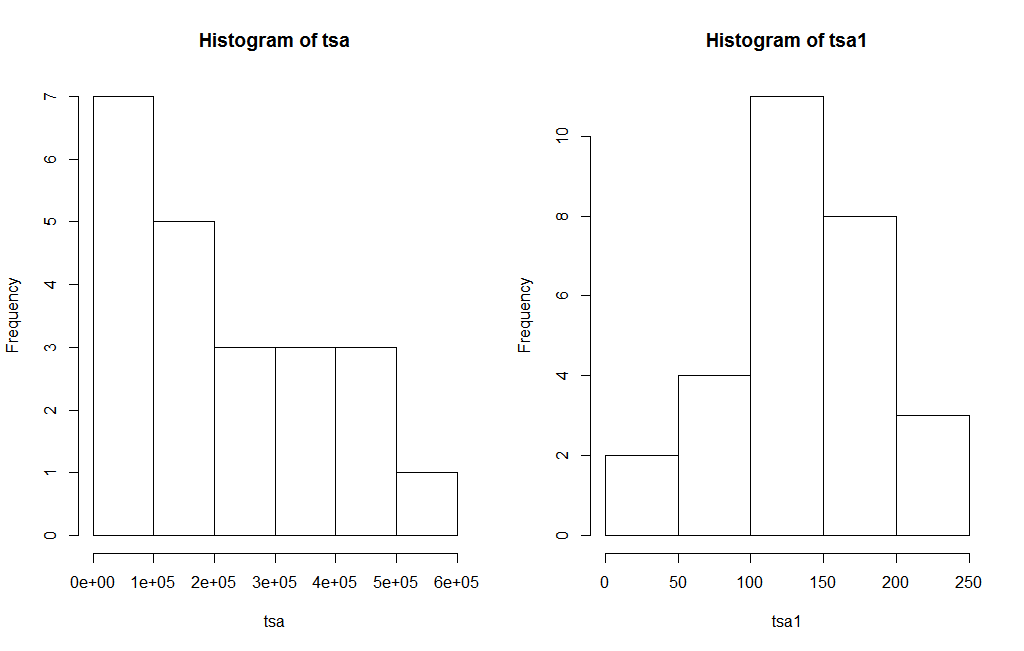 Figure 1. Frequency distribution of Time series before(left figure) and after(right figure) use of Box-Cox transformation.
In the next experiment the lambda was obtained using the “loglik” method of Box-Cox. This lambda was used in the ARIMA technique for forecasting. The results showed that there are 435 records out of 999(43.54%) which have the RMSE of the forecasted results lower (when lambda using the loglik method is used) than the RMSE when no lambda is used. Using lambda (log like method) 198 records (out of 999 records) were obtained as normal data which were not initially normal. Out of 198, 96 records showed lower RMSE of the forecasted results when lambda was used as compared to the RMSE when no lambda was used.
From the above data it is seen that “guerreo” method gives good values of lambda as compared to the “loglik” method, which help in better forecasting results.
References
Guerrero, V.M. (1993) Time-series analysis supported by power transformations. Journal of Forecasting, 12, 37–48.
Appendix
Figure 1. Frequency distribution of Time series before(left figure) and after(right figure) use of Box-Cox transformation.
In the next experiment the lambda was obtained using the “loglik” method of Box-Cox. This lambda was used in the ARIMA technique for forecasting. The results showed that there are 435 records out of 999(43.54%) which have the RMSE of the forecasted results lower (when lambda using the loglik method is used) than the RMSE when no lambda is used. Using lambda (log like method) 198 records (out of 999 records) were obtained as normal data which were not initially normal. Out of 198, 96 records showed lower RMSE of the forecasted results when lambda was used as compared to the RMSE when no lambda was used.
From the above data it is seen that “guerreo” method gives good values of lambda as compared to the “loglik” method, which help in better forecasting results.
References
Guerrero, V.M. (1993) Time-series analysis supported by power transformations. Journal of Forecasting, 12, 37–48.
Appendix