Basketball Data Part III – BMI: Does it Matter?
Want to share your content on R-bloggers? click here if you have a blog, or here if you don't.
For those of you who are just joining us, please refer back to the previous two posts referencing scraping XML data and length of NBA career by position. The next idea I wanted to explore was whether BMI had any effect on the length of NBA careers.
Originally, I had expected centers to have relatively short careers (based on the premise that ridiculous height/weight > shorter careers). In the previous post, I find that centers have normal careers, even longer than forwards on average. So now I want to see if larger players in general have shorter careers. Do those players with higher BMIs last fewer years in the NBA?
I begin by looking at the BMI distribution for all retired NBA players: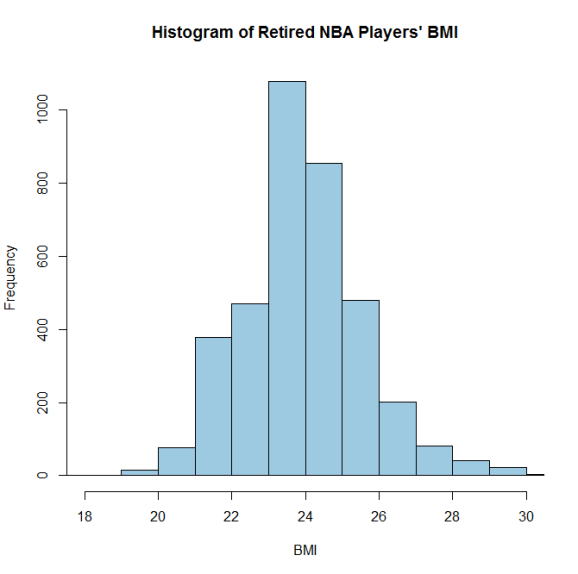 The distribution appears to be fairly normal and the center is around 24. (Note: normal BMIs range between 18.5 and 25, so a fair number of these athletes were “overweight” or had huge muscles.)
Next, I plotted BMI by position: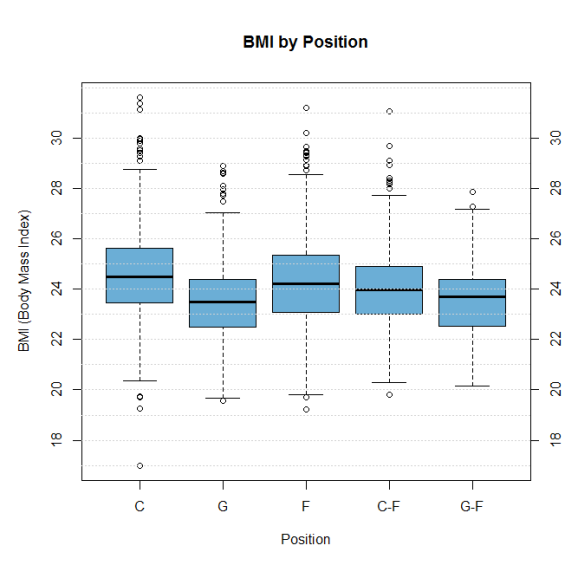 As one would expect, centers have the highest BMI, followed by forwards, followed by guards. Dual position G-Fs have BMIs between guards and forwards (as expected), but dual position C-Fs average lower BMIs than centers or forwards.
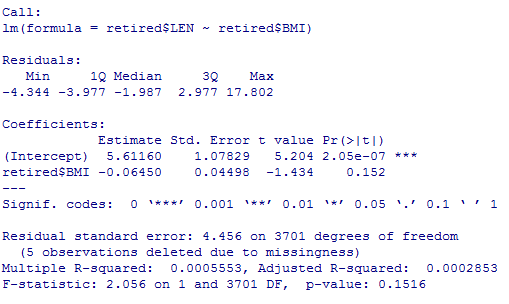
Finally, I plotted career length by BMI: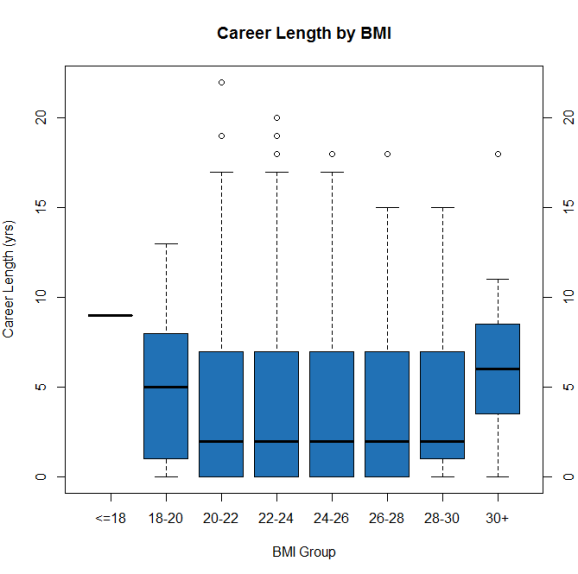 It doesn’t look like there is much relationship between BMI and career length. I ran a simple linear regression model and confirmed that BMI is not a statistically significant predictor of career length.
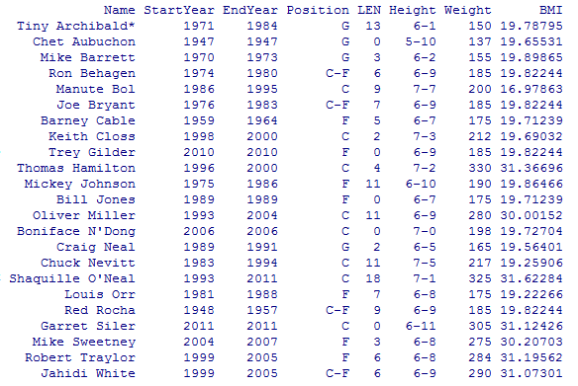
It does appear that outliers on both edges of the BMI distribution do have longer careers. These sample sizes are quite small, but my theory is that these players were so exceptional that they made it to the NBA despite their unusual body types (too big and too small). Their high level of skill led to longer than average careers.
###### Settings
library(XML)
library(RColorBrewer)
col.9<-brewer.pal(9,"Blues")
setwd("C:/Blog/Basketball")

###### URLs
url<-paste0("http://www.basketball-reference.com/players/",letters,"/")
len<-length(url)

###### Reading data
tbl<-readHTMLTable(url[1])[[1]]

for (i in 2:len)
	{tbl<-rbind(tbl,readHTMLTable(url[i])[[1]])}

###### Formatting data
colnames(tbl)<-c("Name","StartYear","EndYear","Position","Height","Weight","BirthDate","College")
tbl$BirthDate<-as.Date(tbl$BirthDate,format="%B %d, %Y")

tbl$StartYear<-as.numeric(as.character(tbl$StartYear))
tbl$EndYear<-as.numeric(as.character(tbl$EndYear))

tbl$Position[tbl$Position=="F-C"]<-"C-F"
tbl$Position[tbl$Position=="F-G"]<-"G-F"
tbl$Position<-factor(tbl$Position,levels=c("C","G","F","C-F","G-F"))

###### Career Length
tbl$LEN<-tbl$EndYear-tbl$StartYear

table(tbl$Position)
boxplot(tbl$LEN~tbl$Position,col="light blue",ylab="Years",xlab="Position",
	main="Length of Career by Position")

###### Age at Retirement
tbl$RetireAge<-tbl$EndYear-as.numeric(substr(tbl$BirthDate,0,4))

boxplot(tbl$RetireAge~tbl$Position,col="light blue",ylab="Retirement Age",xlab="Position",
	main="Retirement Age by Position")

###### Removing Currently Active Players
retired<-tbl[tbl$EndYear<2014,]

boxplot(tbl$LEN~tbl$Position,col="light blue",ylab="Years",xlab="Position",
	main="Length of Career by Position")

boxplot(tbl$RetireAge~tbl$Position,col="light blue",ylab="Retirement Age",xlab="Position",
	main="Retirement Age by Position")

###### BMI Calculation
retired$Height<-as.character(retired$Height)
retired$Weight<-as.numeric(as.character(retired$Weight))
retired$HeightInches<-sapply(strsplit(retired$Height,"-"),function(x) as.numeric(x[1])*12+as.numeric(x[2]))
retired$BMI<-(retired$Weight/(retired$HeightInches^2))*703

hist(retired$BMI,col=col.9[4],xlim=c(18,30),xlab="BMI",main="Histogram of Retired NBA Players' BMI")

par(mar=c(6,5,5,3))
boxplot(retired$BMI~retired$Position,col=col.9[5],yaxt="n",ylab="BMI (Body Mass Index)",xlab="Position",
	main="BMI by Position")
axis(2,at=seq(18,30,by=2),labels=seq(18,30,by=2))
axis(4,at=seq(18,30,by=2),labels=seq(18,30,by=2))
for (i in seq(16,34,by=1))
	{abline(h=i,lty=3,col="lightgray")}

model1<-lm(retired$LEN~retired$BMI)
summary(model1)

retired$BMI_GROUP<-cut(retired$BMI,breaks=c(0,18,20,22,24,26,28,30,9999),
	labels=c("<=18","18-20","20-22","22-24","24-26","26-28","28-30","30+"))

# Removing Players without Weight Info
retired1<-retired[!is.na(retired$BMI),]

boxplot(retired1$LEN~retired1$BMI_GROUP,col=col.9[7],xlab="BMI Group",ylab="Career Length (yrs)",
	main="Career Length by BMI")
axis(4,at=seq(0,20,by=5),labels=seq(0,20,by=5))
table(retired1$BMI_GROUP)

retired1[retired1$BMI_GROUP %in% c("<=18","18-20","30+"),c("Name","StartYear","EndYear",
	"Position","LEN","Height","Weight","BMI")]
R-bloggers.com offers daily e-mail updates about R news and tutorials about learning R and many other topics. Click here if you're looking to post or find an R/data-science job.
Want to share your content on R-bloggers? click here if you have a blog, or here if you don't.

