Downloading weather, sea ice, and wave model data with the rNOMADS package in R
Want to share your content on R-bloggers? click here if you have a blog, or here if you don't.
The NOAA Operational Model Archive and Distribution System is a treasure trove of near real time and archived model outputs describing global and regional weather, sea ice, and wave data. I developed the rNOMADS package about a year ago to make this available to R users. In this post, I’ll present some source code and a couple of figures showing a few of the useful things you can do with rNOMADS.
For detailed examples showing rNOMADS with GRIB file support (Linux only) see the vignette here, for a cross platform version of the same, see here.
1. Getting wind speed at a specific point
library(rNOMADS)

#A location near my house
lat <- 35.828304
lon <- -79.107467

#Find the latest Global Forecast System model run
model.urls <- GetDODSDates("gfs_hd")
latest.model <- tail(model.urls$url, 1)
model.runs <- GetDODSModelRuns(latest.model)
latest.model.run <- tail(model.runs$model.run, 1)

#Get nearest model nodes
lons <- seq(0, 359.5, by = 0.5)
lats <- seq(-90, 90, by = 0.5)
lon.diff <- abs(lon + 360 - lons)
lat.diff <- abs(lat - lats)
model.lon.ind <- which(lon.diff == min(lon.diff)) - 1 #NOMADS indexes at 0
model.lat.ind <- which(lat.diff == min(lat.diff)) - 1

#Subset model
time <- c(0,0) #Model status at initialization
lon.inds <- c(model.lon.ind - 2, model.lon.ind + 2)
lat.inds <- c(model.lat.ind - 2, model.lat.ind + 2)
variable <- "ugrd10m" #First get east-west wind

u.grd.data <- DODSGrab(latest.model, latest.model.run, variable,
   time, lon.inds, lat.inds)

variable <- "vgrd10m" #Then get north-south wind

v.grd.data <- DODSGrab(latest.model, latest.model.run, variable,
   time, lon.inds, lat.inds)

#Reformat the data
u.grd.grid <- ModelGrid(u.grd.data, c(0.5, 0.5))
v.grd.grid <- ModelGrid(v.grd.data, c(0.5, 0.5))

#Interpolate it to the point of interest
u.point <- BuildProfile(u.grd.grid, lon, lat, TRUE)
v.point <- BuildProfile(v.grd.grid, lon, lat, TRUE)

#Present results!
print(paste("The East-West winds at Briar Chapel are going", sprintf("%.2f", u.point),
    "meters per second, and the north-south winds are going", sprintf("%.2f", v.point),
    "meters per second."))

#How did I know all these strange parameter names?
info <- GetDODSModelRunInfo(latest.model, latest.model.run)
print(info)
2. Getting a temperature profile from 0 to 40 km above a specific point
library(rNOMADS)

#A location near my house
lat <- 35.828304
lon <- -79.107467

#Find the latest Global Forecast System model run
model.urls <- GetDODSDates("gfs_hd")
latest.model <- tail(model.urls$url, 1)
model.runs <- GetDODSModelRuns(latest.model)
latest.model.run <- tail(model.runs$model.run, 1)

#Get nearest model nodes
lons <- seq(0, 359.5, by = 0.5)
lats <- seq(-90, 90, by = 0.5)
lon.diff <- abs(lon + 360 - lons)
lat.diff <- abs(lat - lats)
model.lon.ind <- which(lon.diff == min(lon.diff)) - 1 #NOMADS indexes at 0
model.lat.ind <- which(lat.diff == min(lat.diff)) - 1

#Subset model
time <- c(0,0) #Model status at initialization
lon.inds <- c(model.lon.ind - 2, model.lon.ind + 2)
lat.inds <- c(model.lat.ind - 2, model.lat.ind + 2)
levels <- c(0, 46) #All pressure levels
variable <- "tmpprs" #First get temperature

tmpprs.data <- DODSGrab(latest.model, latest.model.run, variable,
   time, lon.inds, lat.inds, levels)

variable <- "hgtprs" #Now get elevation of each pressure level
hgtprs.data <- DODSGrab(latest.model, latest.model.run, variable,
   time, lon.inds, lat.inds, levels)

#Reformat the data
tmpprs.grid <- ModelGrid(tmpprs.data, c(0.5, 0.5))
hgtprs.grid <- ModelGrid(hgtprs.data, c(0.5, 0.5))

#Interpolate it to the point of interest
tmpprs.point <- BuildProfile(tmpprs.grid, lon, lat, TRUE)
hgtprs.point <- BuildProfile(hgtprs.grid, lon, lat, TRUE)

#Plot it!
plot(tmpprs.point - 272.15, hgtprs.point, xlab = "Temperature (C)",
   ylab = "Elevation (m)", main = paste("Temperature above Chapel Hill, NC, at",
   tmpprs.grid$model.run.date))
2. A world map of surface temperature
library(GEOmap)
library(rNOMADS)

model.urls <- GetDODSDates("gfs_hd")
latest.model <- tail(model.urls$url, 1)
model.runs <- GetDODSModelRuns(latest.model)
latest.model.run <- tail(model.runs$model.run, 1)

time <- c(0,0) #Analysis model
lon <- c(0, 719) #All 720 longitude points
lat <- c(0, 360) #All 361 latitude points

tmp2m.data <- DODSGrab(latest.model, latest.model.run,
    "tmp2m", time, lon, lat)
atmos <- ModelGrid(tmp2m.data, c(0.5, 0.5), "latlon")
colormap <- rev(rainbow(500, start = 0 , end = 5/6))
image(atmos$x, sort(atmos$y), atmos$z[1,1,,], col = colormap,
    xlab = "Longitude", ylab = "Latitude",
    main = paste("World Temperature at Ground Level:", atmos$model.run.date))
plotGEOmap(coastmap, border = "black", add = TRUE,
    MAPcol = NA)
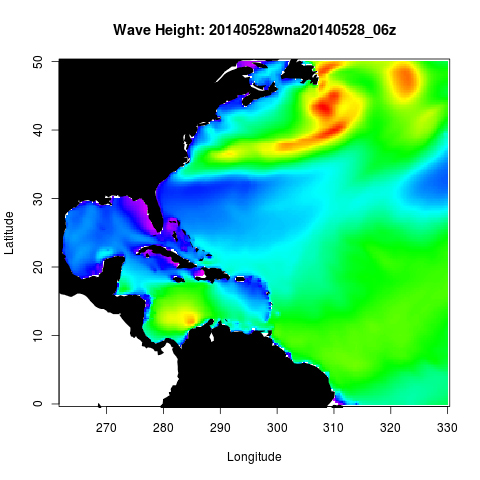
2. Wave heights in the northwest Atlantic ocean
library(GEOmap)
library(rNOMADS)
model.urls #Get latest forecast for West North Atlantic waves
model.url model.runs latest.model.run
time lat lon variable <- “htsgwsfc” #Wave height
wave.data variable, time, lon, lat)
wave.grid 1e10, arr.ind=TRUE)] colormap image(wave.grid$x, sort(wave.grid$y), wave.grid$z[1,1,,], col = colormap,
xlab = “Longitude”, ylab = “Latitude”,
main = paste(“Wave Height:”, wave.grid$model.run.date))
plotGEOmap(coastmap, border = “black”, add = TRUE,
MAPcol = “black”)
[/code]
R-bloggers.com offers daily e-mail updates about R news and tutorials about learning R and many other topics. Click here if you're looking to post or find an R/data-science job.
Want to share your content on R-bloggers? click here if you have a blog, or here if you don't.


