President Approval Ratings from Roosevelt to Obama
Want to share your content on R-bloggers? click here if you have a blog, or here if you don't.
I have been watching the awesome Netflix show “House of Cards” and been fascinated by the devious schemes that Underwood is constantly plotting. The show often mentions approval ratings and it got me to wondering what Obama’s ratings currently were, and all other past US president for that matter. However, I didn’t have much chance finding publicly available data that was a) easily accessible and b) free. (granted – I was quite lazy in my search).
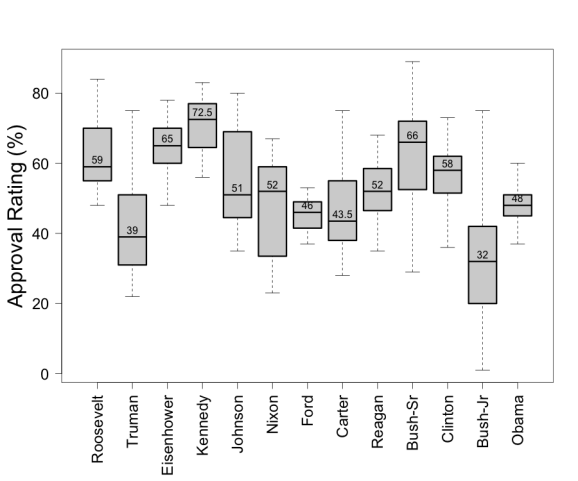
Ultimately, I resorted to scraping the Roper Center website for the data that I needed. Below is the distribution of approval ratings for each president from Roosevelt (when records began) to Obama.
JFK, Bush-Sr and Eisenhower rank as the top three presidents which the highest approval rate during their tenure in the presidential office. However, the variation in ratings for Bush-Sr was considerably larger. Similarly, Truman and Bush-Jr has large variance in their ratings, but were also the two most unpopular presidents. As we can also see, Obama does not rank very high amongst presidential approval ratings, with only four other presidents with lower ratings (although it should be noted that Obama still has three remaining years to bump up his average).
Below is the breakdown of approval ratings for each individual president. Note some of the sharp peaks that we see for some presidents, like the spike in approval ratings for Bush-Jr after the 9/11 tragedy; or the drop in ratings for Bush-Sr and Nixon after the start of the Iraq war and Watergate, respectively.
R-bloggers.com offers daily e-mail updates about R news and tutorials about learning R and many other topics. Click here if you're looking to post or find an R/data-science job.
Want to share your content on R-bloggers? click here if you have a blog, or here if you don't.


