Who uses E-Bikes in Toronto? Fun with Recursive Partitioning Trees and Toronto Open Data
Want to share your content on R-bloggers? click here if you have a blog, or here if you don't.
I found a fun survey released to the Toronto Open Data website that investigates the travel/commuting behaviour of Torontonians, but with a special focus on E-bikes. When I opened up the file, I found various demographic information, in addition to a question asking people their most frequently used mode of transportation. Exactly 2,238 people responded to this survey, of which 194 were frequent E-bike users. I figured that’s enough to do some data mining and an especially fun opportunity to use recursive partitioning trees to do that data mining!
Following is the code I used (notice in the model statements that I focus specifically on E-bike users versus everyone else):
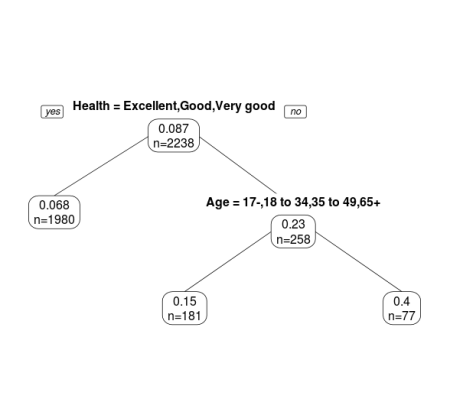
Here is the first tree based on Sex, Health, and Age (Remember that the factor levels shown are not the only ones. When you look on the “no” side of the tree, it means that you are examining the proportion of ebike users who are described by factor levels not shown):

As you can see, only Health and Age came out as significantly discriminating between E-bike users and everyone else. What this tree is telling us is that it’s in fact those people who are not in “Excellent, Good, Very good” health who are likely to use E-bikes, but rather an un-shown part of the Health spectrum: “Other,Fairly good,Poor”. That’s interesting in and of itself. It seems that of those people who are in Excellent or Very Good health, they are more likely (44%) to be riding Bicycles than people in other levels of health (23%). That makes sense! You’re not going to choose something effortful if your health isn’t great.
We also see a very interesting finding that it is in fact the 50 – 64 year olds (whose health isn’t great) who are more likely to be riding an E-bike compared to people of all other age groups!
Here’s the second tree based on Education and Income:

Here we see that it is in fact not the university educated ones more likely to ride E-bikes, but in fact people with “College or trade school diploma,High school diploma”. Interesting!! Further, we see that amongst those who aren’t university educated, it’s those who say they make lower than $80,000 in income who are more likely to ride E-bikes.
So now we have an interesting picture emerging, with two parallel descriptions of who is most likely to ride E-bikes:
1) 50 – 64 year olds in not the greatest of health
and
2) Non University educated folks with lower than $80,000 income.
Toronto, these are your E-bike users!
R-bloggers.com offers daily e-mail updates about R news and tutorials about learning R and many other topics. Click here if you're looking to post or find an R/data-science job.
Want to share your content on R-bloggers? click here if you have a blog, or here if you don't.
