
The Brand as Affordance: Item Response Modeling of Brand Perceptions
[This article was first published on Engaging Market Research, and kindly contributed to R-bloggers]. (You can report issue about the content on this page here)
Want to share your content on R-bloggers? click here if you have a blog, or here if you don't.
It is just too easy to think of a brand as a web of associations. What comes to mind when I say “Subway Sandwich”? Did you remember a commercial or the “eat fresh” tagline? Without much effort, one can generate a long list of associations with the Subway brand, and why not map all those associations with a network structure? In marketing we refer to such a representation as a brand concept map. Although you can draw it by hand, R has qgraph and igraph and a lot of other packages that will create network representations from association matrices. But does this have anything to do with the purchase decision?Want to share your content on R-bloggers? click here if you have a blog, or here if you don't.

The Latent Variable Underlying Brand Perception is Affordance
In the purchase context, brand is not a concept but an affordance. It is “as if” your personal preferences and the purchase occasion have generated a checklist of features and services that you desire in this particular context. Actually, they have created an ordered checklist of features and services that you would like the brand to deliver. The ordering reflects the severity of your demands, for example, your willingness to purchase if the brand fails to deliver. Thus, you may not be willing to compromise on speed and a place to sit. You can live without your favor cheese, but a long line is a deal breaker.
The brand must pass your “test” in order for you to become a customer. Your criteria are like items on an exam arranged in increasing difficulty for the brand to achieve. How well does Subway perform? Why not ask consumers to indicate which features and services a brand would be able to deliver in a specific purchase occasion? Our goal is to provide enough realism that consumers could see themselves buying in this context. They must be familiar enough with the brand that they can anticipate how well it would deliver each feature and service, and they must have sufficient experience in this or similar situations that they will know what they would want.
The result is a pattern of zeros and ones for each respondent, not unlike what we would find looking at the correct and incorrect scores for a series of item from an exam. In this case the exam is written by the consumer with item difficulty for the brand measured by the number of potential customers lost if the brand fails to perform.
An example might help, so why not use our eight attributes listed above: quick ordering, fast preparation, good seating, menu selection, freshness, filling, healthy, and tasty. We will use the airport description above, show the picture, and give each respondent the 8-item checklist. Let’s pretend that we are such a respondent. We like the “subs” so we check “yes” for taste and filling. Although some of the sandwich do not seem that healthy or fresh to us, there are alternatives that are, so we check “yes” for healthy and fresh. But we have found slow service, limited menu options, and subpar seating. We end up with four ones and four zeros. And what do we do with those who really like Subway? They do not feel that the menu is limited; they can get their favorite sandwich. Nor do they believe that service is all that bad. The seating, on the other hand, is not the best so their checklist might have seven ones and only one zero.
Doesn’t this seem like a test that Subway takes repeatedly with every potential customer? Successful brands are not unaware of what consumers want. In fact, they promote themselves as providing these benefits. Consumers hear the advertising and read the signage. Whether you love or hate Subway, freshness will be the attribute you most associate with the brand. It is Subway’s unique selling proposition, and it appeals to consumers who hold a similar customer value proposition.
What about Quiznos? Yes, there is a product category, and every brand in the product category shares the same value proposition with the same rank ordering of feature/service delivery. My claim is that the response pattern will be the same for Subway and Quiznos because they belong to the same product category with the same value proposition. If Quiznos’ market share is smaller than Subway’s, then the percentage checking “yes” may be lower but the pattern will be the same (see Bryon Sharp for an entertaining overview at TED).
If we were to construct a perceptual map that plotted relative profiles (e.g., correspondence analysis), we would expect to see Subway and Quiznos near each other and some distance away from McDonalds, Burger King, and Wendy’s. Moreover, the perceptual map would look the same regardless of how we segmented the respondents. I know this because my clients frequently ask to run the same correspondence map for different subgroups: users vs. nonuser, heavy users vs. light users, young vs. old, Brand A vs. Brand B, and so on. Of course, brands “bounce” around by a bit due to random variation, but the map maintains the same overall structure because we all share a common consumption culture.
Item Response Theory
Continuing with the testing metaphor, why not use item response theory to analyze our checklist data? Let’s put Subway to the test, and see what respondents think when given our eight item checklist. I have listed all the R code that you will need to run a toy example with a simulated sample of 200 randomly generated respondents. I believe that the annotation is sufficient to explain the code, but I will provide an overview.
The latent variable is Subway’s perceived affordance. That is, respondents are believed to possess some level of confidence or trust that Subway is capable of delivering on its brand promise. Subway promises freshness and healthy food but also taste and selection. Moreover, it claims to be a fast food, so there are additional service promises, although these might be considered secondary. The checklist contains items that can be arranged in order so that the checking of an item at a higher level implies the checking of items at all the lower levels. High and low levels refer to the latent variable, which in this case is affordance, or how difficult is it for Subway to deliver on its promise. You will see this in the R code as difficulty or d. Difficulty is measured on a scale with mean=0 and standard deviation=1 so that a +2 is a very difficulty item with few respondents likely to check and a -2 is so easy that most will mark the box.
Respondents are measured on the same scale as the items. Because item response theory began in educational assessment, we use the term “ability” to refer to our trust latent variable. If it helps, you can think of it as a respondent’s ability to trust Subway to keep its promise. Regardless of its name, more and more items get checked as respondents score higher on the latent variable. Thus, consumers who love Subway have high ability to trust and check most of the items. Consumers who are not as fond have low ability to trust Subway and check fewer of the items. However, the checking is not random but follows item difficulty. We call this pattern of responding to items a Guttman scale.
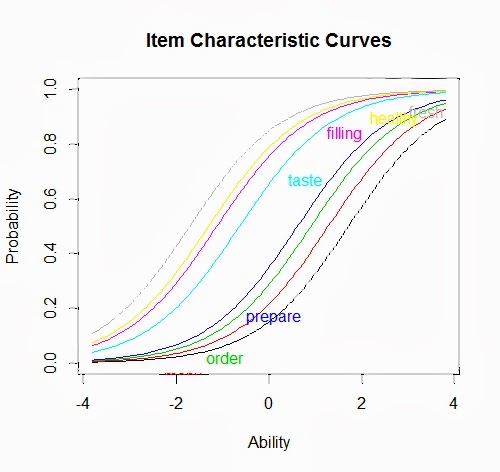
When you run the R code below, you will create the following figure summarizing the main finding that as “ability to trust” increases, the probability of checking each item increases with the least difficult items most likely to be checked at any location along the scale. The curves follow the ordering of item difficulty with the four items concerning food near each other at the lower end of the ability scale and the four items measuring service grouping toward the higher end. Most trust Subway to deliver on the food; fewer believe that Subway will succeed when it comes to service.

To be clear, we are assuming the existence of a “fresh fast food” product category with a unique selling proposition consisting of a set of promises that can be ordered in terms of ease of delivery. Consumers, in general, understand what is promised and accept that some promises will be more difficult to keep than others. When the more difficult is achieved, we speak of exceeding expectations. Consumers see the brand as more or less committed to providing “fresh fast food” based on the brand’s ability to deliver on each of the items. In fact, a brand’s performance on an item is attributed to the brand’s commitment. Consequently, all the items are interconnected in that they all depend on the brand as an intentional agent.
The item characteristic curves below show the entire response pattern. Each item that is checked is not an independent association with a brand. It is a reflection of the respondent’s ability to trust that the brand will deliver on the “fresh fast food” value proposition. As a result, all the items are interdependent such that a change in any one item will impact all the remaining items. Moreover, marketing actions or events that directly impact the latent variable will move all the items higher or lower (e.g., corporate philanthropy or scandal).
Conclusion: If we ask about the brand outside of the purchase context, we are likely to discover a rich associative network as if the brand were a concept. However, when we embedded our respondent in a realistic setting, we learn that only a small portion of that vast associative network is needed to make a purchase. If our goal is to predict consumer response in the marketplace, we will need to be more careful about how we ask the question and how we analyze the resulting data.
The brand must pass your “test” in order for you to become a customer. Your criteria are like items on an exam arranged in increasing difficulty for the brand to achieve. How well does Subway perform? Why not ask consumers to indicate which features and services a brand would be able to deliver in a specific purchase occasion? Our goal is to provide enough realism that consumers could see themselves buying in this context. They must be familiar enough with the brand that they can anticipate how well it would deliver each feature and service, and they must have sufficient experience in this or similar situations that they will know what they would want.
The result is a pattern of zeros and ones for each respondent, not unlike what we would find looking at the correct and incorrect scores for a series of item from an exam. In this case the exam is written by the consumer with item difficulty for the brand measured by the number of potential customers lost if the brand fails to perform.
An example might help, so why not use our eight attributes listed above: quick ordering, fast preparation, good seating, menu selection, freshness, filling, healthy, and tasty. We will use the airport description above, show the picture, and give each respondent the 8-item checklist. Let’s pretend that we are such a respondent. We like the “subs” so we check “yes” for taste and filling. Although some of the sandwich do not seem that healthy or fresh to us, there are alternatives that are, so we check “yes” for healthy and fresh. But we have found slow service, limited menu options, and subpar seating. We end up with four ones and four zeros. And what do we do with those who really like Subway? They do not feel that the menu is limited; they can get their favorite sandwich. Nor do they believe that service is all that bad. The seating, on the other hand, is not the best so their checklist might have seven ones and only one zero.
Doesn’t this seem like a test that Subway takes repeatedly with every potential customer? Successful brands are not unaware of what consumers want. In fact, they promote themselves as providing these benefits. Consumers hear the advertising and read the signage. Whether you love or hate Subway, freshness will be the attribute you most associate with the brand. It is Subway’s unique selling proposition, and it appeals to consumers who hold a similar customer value proposition.
What about Quiznos? Yes, there is a product category, and every brand in the product category shares the same value proposition with the same rank ordering of feature/service delivery. My claim is that the response pattern will be the same for Subway and Quiznos because they belong to the same product category with the same value proposition. If Quiznos’ market share is smaller than Subway’s, then the percentage checking “yes” may be lower but the pattern will be the same (see Bryon Sharp for an entertaining overview at TED).
If we were to construct a perceptual map that plotted relative profiles (e.g., correspondence analysis), we would expect to see Subway and Quiznos near each other and some distance away from McDonalds, Burger King, and Wendy’s. Moreover, the perceptual map would look the same regardless of how we segmented the respondents. I know this because my clients frequently ask to run the same correspondence map for different subgroups: users vs. nonuser, heavy users vs. light users, young vs. old, Brand A vs. Brand B, and so on. Of course, brands “bounce” around by a bit due to random variation, but the map maintains the same overall structure because we all share a common consumption culture.
Item Response Theory
Continuing with the testing metaphor, why not use item response theory to analyze our checklist data? Let’s put Subway to the test, and see what respondents think when given our eight item checklist. I have listed all the R code that you will need to run a toy example with a simulated sample of 200 randomly generated respondents. I believe that the annotation is sufficient to explain the code, but I will provide an overview.
The latent variable is Subway’s perceived affordance. That is, respondents are believed to possess some level of confidence or trust that Subway is capable of delivering on its brand promise. Subway promises freshness and healthy food but also taste and selection. Moreover, it claims to be a fast food, so there are additional service promises, although these might be considered secondary. The checklist contains items that can be arranged in order so that the checking of an item at a higher level implies the checking of items at all the lower levels. High and low levels refer to the latent variable, which in this case is affordance, or how difficult is it for Subway to deliver on its promise. You will see this in the R code as difficulty or d. Difficulty is measured on a scale with mean=0 and standard deviation=1 so that a +2 is a very difficulty item with few respondents likely to check and a -2 is so easy that most will mark the box.
Respondents are measured on the same scale as the items. Because item response theory began in educational assessment, we use the term “ability” to refer to our trust latent variable. If it helps, you can think of it as a respondent’s ability to trust Subway to keep its promise. Regardless of its name, more and more items get checked as respondents score higher on the latent variable. Thus, consumers who love Subway have high ability to trust and check most of the items. Consumers who are not as fond have low ability to trust Subway and check fewer of the items. However, the checking is not random but follows item difficulty. We call this pattern of responding to items a Guttman scale.
When you run the R code below, you will create the following figure summarizing the main finding that as “ability to trust” increases, the probability of checking each item increases with the least difficult items most likely to be checked at any location along the scale. The curves follow the ordering of item difficulty with the four items concerning food near each other at the lower end of the ability scale and the four items measuring service grouping toward the higher end. Most trust Subway to deliver on the food; fewer believe that Subway will succeed when it comes to service.
To be clear, we are assuming the existence of a “fresh fast food” product category with a unique selling proposition consisting of a set of promises that can be ordered in terms of ease of delivery. Consumers, in general, understand what is promised and accept that some promises will be more difficult to keep than others. When the more difficult is achieved, we speak of exceeding expectations. Consumers see the brand as more or less committed to providing “fresh fast food” based on the brand’s ability to deliver on each of the items. In fact, a brand’s performance on an item is attributed to the brand’s commitment. Consequently, all the items are interconnected in that they all depend on the brand as an intentional agent.
The item characteristic curves below show the entire response pattern. Each item that is checked is not an independent association with a brand. It is a reflection of the respondent’s ability to trust that the brand will deliver on the “fresh fast food” value proposition. As a result, all the items are interdependent such that a change in any one item will impact all the remaining items. Moreover, marketing actions or events that directly impact the latent variable will move all the items higher or lower (e.g., corporate philanthropy or scandal).
# use psych package to simulate Rasch model data
library(psych)

# need to set seed in order to obtain same result each time
set.seed(36321)

# 8 items with difficulty specified by vector d
# 200 respondents from normal distribution with mean 0 and variance 1
Toy<-sim.rasch(nvar=8, n=200, d=c(+2.0, +1.5, +1.0, +0.5, -0.5, -1.0, -1.5, -2.0))

# output is a list with binary 0 and 1 items in $items
ToyData<-Toy$items
colnames(ToyData)<-c("seat", "menu", "order", "prepare", "taste", "filling", "healthy","fresh")

# optional ordering of data matrix to see how pattern of 0s and 1s change with increasing total scores
item<-apply(ToyData,2,mean)
person<-apply(ToyData,1,sum)
ToyDataOrd<-ToyData[order(person),order(item)]
col_mean<-apply(ToyDataOrd,2,mean)*100
ToyDataOrd<-rbind(ToyDataOrd,col_mean)
row_sum<-apply(ToyDataOrd,1,sum)
ToyDataOrd<-cbind(ToyDataOrd,row_sum)
ToyDataOrd<-cbind(1:201,ToyDataOrd)
round(ToyDataOrd)

# use ltm package to run Rasch model
library(ltm)
descript(ToyData)
fit<-rasch(ToyData)
fit
plot(fit)
To leave a comment for the author, please follow the link and comment on their blog: Engaging Market Research.
R-bloggers.com offers daily e-mail updates about R news and tutorials about learning R and many other topics. Click here if you're looking to post or find an R/data-science job.
Want to share your content on R-bloggers? click here if you have a blog, or here if you don't.