
Data fishing: R and XML part 2
Want to share your content on R-bloggers? click here if you have a blog, or here if you don't.
I’m constantly amazed at what can be done using free software, such as R, and more importantly, what can be done with data that are available on the internet. In an earlier post, I confessed to my sedentary lifestyle immersed in code, so my opinion regarding the utility of open-source software is perhaps biased. None the less, I’m convinced that more people would start using and continue to use R once they’ve realized the limitless applications.
My first post highlighted what can be done using the XML package, or more generally, what can be done ‘stealing’ data from the internet using free software and publicly available data. I return to this concept in this blog to show you, and hopefully convince you, that learning how to code your own functions for data mining is a worthwhile endeavor. My last example showed how we can get depth data for lakes from the Lakefinder website maintained by the Minnesota Department of Natural Resources. I’ll admit the example was boring and trivial, but my intention was to introduce the concept as the basis for further blogs. The internet contains an over-abundance of information and R provides several useful tools to gather and analyze this information.
After seeing this post about data mining with Twitter (check the video!), I was motivated to create a more interesting example than my previous posting using LakeFinder. Minnesota, the land of 11,842 lakes, has some of the best fishing in the country. The ostensible purpose of Lakefinder is to provide anglers access to lake data gathered by MNDNR. Most people don’t care about lake depth, so I developed a more flexible function that accesses data from fish surveys. The fisheries division at MNDNR collects piles and piles of fish data and Lakefinder should have the most current survey information for managed lakes (although I don’t know how often the data are updated). Each year, local offices conduct trap net surveys in nearshore areas and gill net surveys to sample fish in open water. An example of the data is shown for Christmas Lake under ‘Fish Sampled for the 2007 Survey Year’. Species are listed in each row and species catch is listed in the columns. Fish per net can be considered a measure of abundance and is often correlated with angler catch. Lakes with higher fish per net, in either trap or gill nets, likely have better fishing.
The purpose of this blog is to describe a custom R function for gathering information about fish catch off LakeFinder. Those outside of Minnesota will have little use for the data gathered by this function. However, I think the most important implication is that anyone with a computer has the potential to develop customized functions to gather a potentially limitless amount of information from the internet. I hope the results I’ve obtained using this function will convince you of this fact. I’ll save the juicy tidbits for my next blog (where are the best lakes?).
What started as a straightforward idea quickly turned into a rather nasty problem handling exceptions when the website contained information that didn’t match the search criteria used in the function. The trick to writing a useful function is to incorporate enough flexibility so that it can accommodate all cases or forms of the data. For example, a function that can only process data frames will fail if it tries to process a list. This concept is central to programming and helps us understand why the fish catch function seems so complex. I had to create a function that could handle every instance in the fish catch table for each lake where the species data existed in a form that made it unambiguous to identify (i.e., it was obvious that the species was or was not in the survey for a given gear type).
Here are some examples illustrating how the function can identify the correct species and net type for each lake:
| Fish name | Net type | Catch |
|---|---|---|
| Bluegill | Gill | 0.6 |
| Northern Pike | Trap | 12.2 |
| Bluegill | Trap | 32.1 |
| Walleye | Gill | 12.6 |
This example is easy enough if we are looking for bluegill in trap nets. All we have to is pull out the rows with Bluegill in the first column, then identify the row with the correct net type, and append the value in the third column to our output. The next example illustrates a case that isn’t so clear.
| Fish name | Net type | Catch |
|---|---|---|
| Bluegill | Gill | 0.6 |
| Trap | 32.1 | |
| Northern Pike | Trap | 12.2 |
| Walleye | Gill | 12.6 |
Say we’ve written the function to identify fish and net data using only criteria that can handle data in the first table. We run into problems if we apply the same criteria to identify the catch of bluegill in trap nets for the second table (a common form for the Lakefinder survey data). We can’t identify all bluegill rows using species name in the first column since it isn’t labelled for trap nets. Nor can we identify bluegill based on our designated net type (Northern Pike were also caught in trap nets). One workaround is to pull out the single row with Bluegill and the following row. Then we can check which row of the two contains trap nets in the second column This assumes an empty row name for species is bluegill, which is a valid assumption considering data in the previous row are for bluegill. What if the species column for the row below bluegill isn’t blank and contains another species? We can’t use our ‘bluegill + next row’ rule, so we have to incorporate further selection techniques to reach an unambiguous solution. Hopefully you can see how complexity quickly emerges from what initially seemed like a simple task.
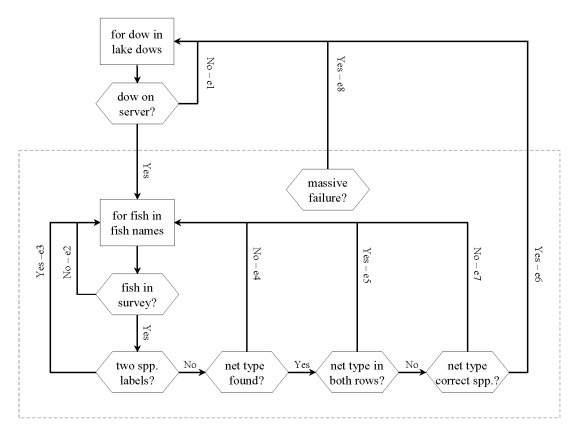
The final code for the function incorporated eight different selection methods based on how the data were presented on Lakefinder. The code is pretty nasty-looking, so here’s a flowchart that shows what the function does.
Here’s what it looks like to use the function in R:
#create string of lake ids to search
dows.in<-c('27013700','82004600','82010400')

#create string of fish names to search
fish.names<-c('Bluegill','Largemouth Bass','Northern Pike')

#use the function
catch.fun(dows=dows.in, fish.str=fish.names, net.type='Trap', trace=T, clean=F)
There are five arguments for catch.fun. The first two are required and the last three have default values. ‘dows’ is a string of lake DOW numbers that identify the lakes you want to search (these numbers are available on the DNR Data Deli). ‘fish.str’ is a string of common fish names that will be searched. The ‘net.type’ is a string that specifies whether you want to search trap net (default) or gill net data (as ‘Trap’ or ‘Gill’). ‘trace’ is a logical argument that indicates if text showing progress will be returned as the function runs. Finally, ‘clean’ is a logical argument that indicates if the function will return output with only lake and fish data. I’ll explain in a bit why I included this last argument.
Now some details (skip if you’re bored)… the flowchart indicates that the fish names in ‘fish.str’ are searched for each lake in ‘dows’ using a nested loop with lake dow at the top level and fish name at the bottom level (denoted by the dotted line box). The tricky part comes when we have to deal with the different forms of the data I mentioned earlier. The flowchart has several hexagonal decision nodes that determine how the data are interpreted in the function. Each time the function reaches an unambiguous result, the yes/no decisions include an exception code (‘e1′ through ‘e8′) that specifies the form of the data that was found. Starting with the first exception (‘e1′), we can see what is meant by terminal. An ‘e1′ is returned while searching a lake DOW if the lake doesn’t exist on LakeFinder or if a lake exists but the survey isn’t available. If the lake and survey both exist, the function jumps into the loop through each species. The first check within the fish loop determines if the fish being searched is present in the survey. If not, ‘e2′ (second exception) is entered for the species and the loop continues to the next. Zero values are returned if a fish isn’t in a survey, otherwise NA is returned for no survey or no lake data. The function continues through several more decision nodes until a final result for each species in each lake is obtained.
Finally, I included a safety measure that allows the function to continue running if some unforeseen issue is encountered (‘massive failure’). This exception (‘e8′) will be returned if an error occurs at any point during the fish search. This only occurred once because someone had entered two species names for the same fish and same net type in the same lake (unresolved, unforeseen ambiguity). Its a good idea to include safety nets in your functions because its very difficult to be 100% certain the function captures all exceptions in the data. Rather than having the function crash, the error is noted and the function continues.
Alright, enough of that. Let’s see what the function returns. Using the above code, we get the catch for the three lakes based on the net type and species we wanted to find:
catch.fun(dows=dows.in, fish.str=fish.names, net.type='Trap', trace=T, clean=F)

27013700; 1 of 3
82004600; 2 of 3
82010400; 3 of 3
Time difference of 1.368078 secs
$Bluegill
      dows     fish fish.val result
1 27013700 Bluegill    51.22     e6
2 82004600 Bluegill     9.22     e6
3 82010400 Bluegill    43.56     e6

$`Largemouth Bass`
      dows            fish fish.val result
4 27013700 Largemouth Bass     1.44     e6
5 82004600 Largemouth Bass        0     e7
6 82010400 Largemouth Bass     0.44     e6

$`Northern Pike`
      dows          fish fish.val result
7 27013700 Northern Pike     0.44     e6
8 82004600 Northern Pike     1.33     e6
9 82010400 Northern Pike     2.11     e6
The function returns a list for each species with data frames in each element of the list. The columns of each data frame include the lake name, species (which is redundant), the catch for the specified net type (number of fish per net), and the final decision in the function that lead to the result. I included the ‘result’ column in the data so I could see if the function was actually doing what it was supposed to do. You get cleaner results if you set ‘clean’ as true, obviously. The output will have the result column and the redundant fish column in the data frames removed. Lakes not in Lakefinder or lakes without fish surveys will also be removed.
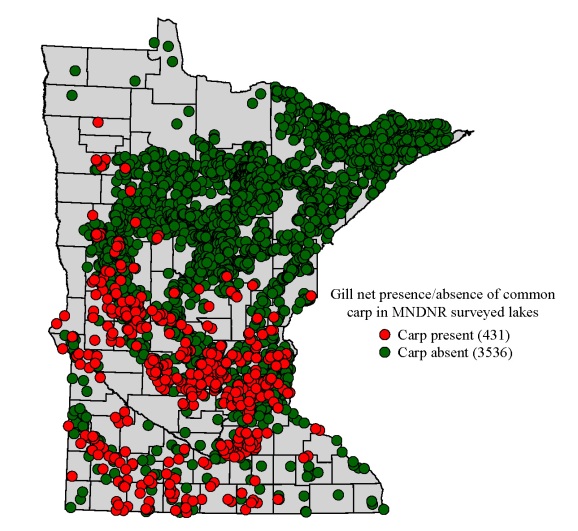
I’ve covered the nitty-gritty of what the function does and how it can be used. The data that can be gathered are of course more interesting than the function and I save a presentation of this material for my next blog. For now, here’s a teaser showing presence/absence of common carp using data obtained with the function. Common carp (not Asian) are ubiquitous in Minnesota and anglers may be interested in carp locations based on the impacts invasive fish have on native species. We can use the function to locate all the lakes surveyed by Minnesota DNR that contain common carp. Thanks to our data fishing we now know to avoid common carp by fishing up north. Stay tuned for the next installment!
Get the function here (requires XML package):

R-bloggers.com offers daily e-mail updates about R news and tutorials about learning R and many other topics. Click here if you're looking to post or find an R/data-science job.
Want to share your content on R-bloggers? click here if you have a blog, or here if you don't.