
Working with Shootout – 2012 in R (001)
[This article was first published on NIR-Quimiometria, and kindly contributed to R-bloggers]. (You can report issue about the content on this page here)
Want to share your content on R-bloggers? click here if you have a blog, or here if you don't.
I have downloaded (from the IDRC) the ASCI files of the Shootout 2012 (see: Shootout 2012 files), so I can work with the data to develop a model and predict a Validation Set.Want to share your content on R-bloggers? click here if you have a blog, or here if you don't.
For that task I have a “Calibration Set”, and a “Test Set”.
We can read details for this task in the IDRC web page: “instructions“.
Spectra is acquire in an FTIR instrument, and the space between wavelengths (X axis) is non linear, so I changed it by values 1.0, 2.0,…….,372.0.
wavelengths<-seq(1.0,372.0,by=1)
I had to arrange the data to import it into R, and to organize the data frame in order to start with the observation of the spectra and the distribution.
As in other posts I am going to use “Chemometrics with R” package.
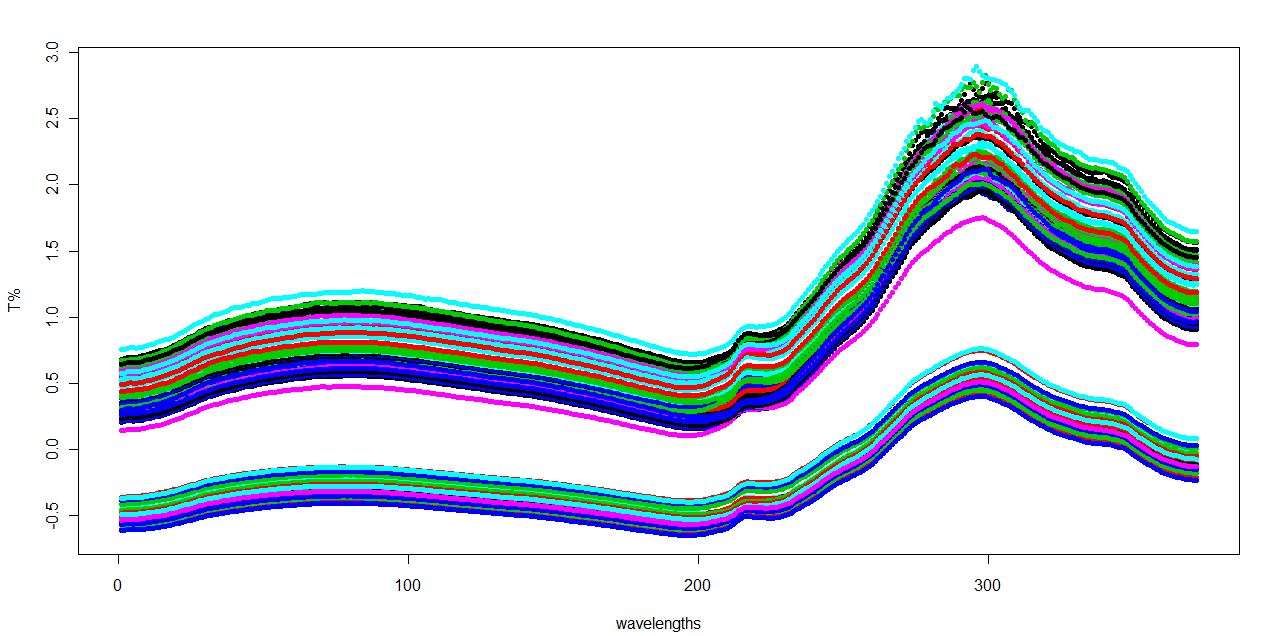
If we plot the calibration samples without any treatment we see like two sets of samples. This is an indication (as we work in transmittance) that probably there are differences in the pathlength:
Now we can apply the MSC (Multiple Scatter Correction) to reduce this physical proprieties and to enhance the chemical changes:
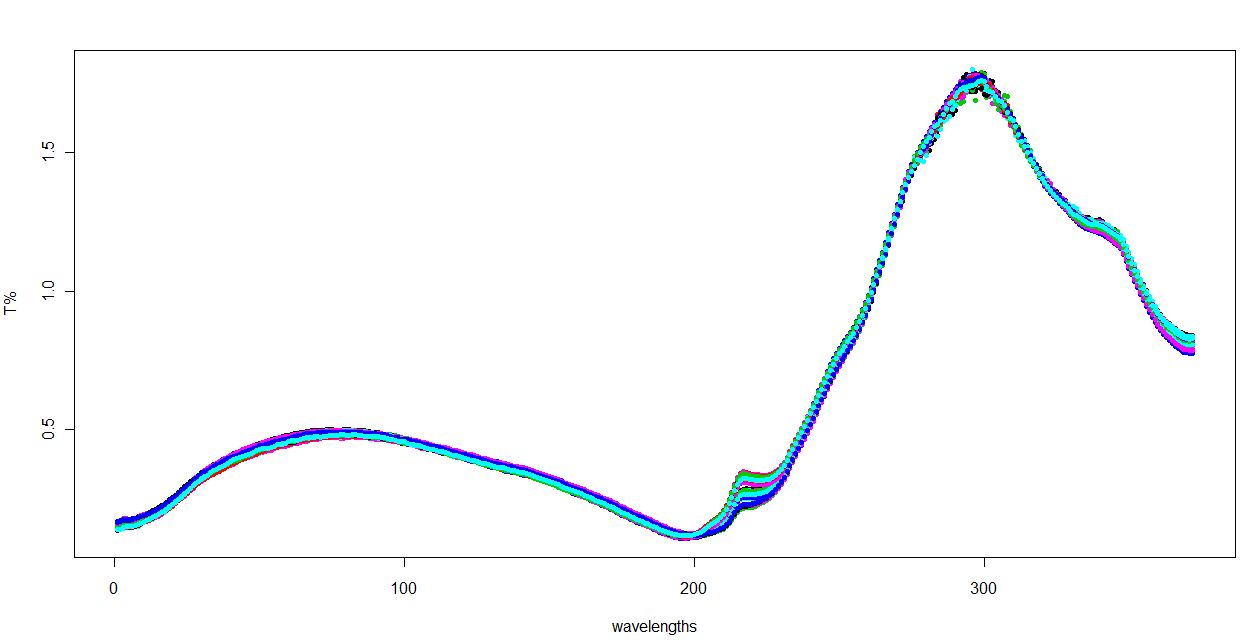
MSC here works really well and we can see that most of the variability is in the area from 200 to 240 aproximatelly.
wave_var<-seq(200.0,240.0,by=1)
matplot(wave_var,t(NITmsc[,200:240]),lty=3,pch=20,
+ lwd=0.1,xlab=”wavelengths”,ylab=”T%”)
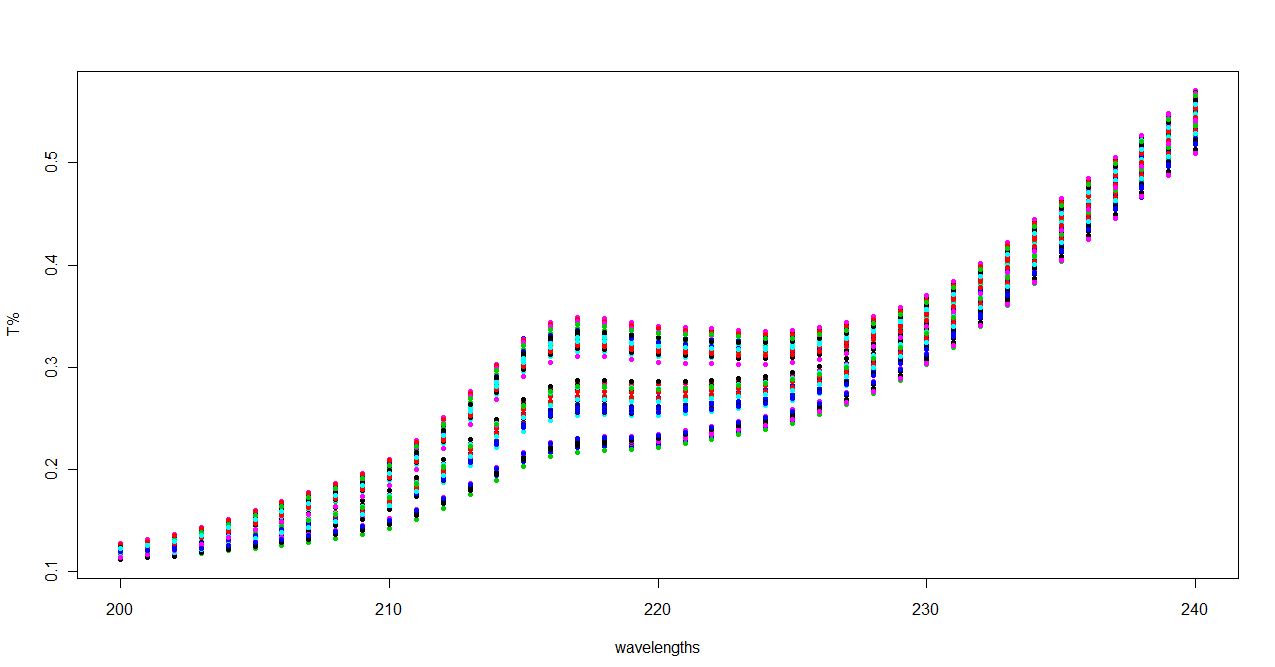
Now we can see at less 3 clusters.
Let´s have a look now to the histogram:
hist(Active,col=”blue”)

We can start to get some conclusions to continue.
To leave a comment for the author, please follow the link and comment on their blog: NIR-Quimiometria.
R-bloggers.com offers daily e-mail updates about R news and tutorials about learning R and many other topics. Click here if you're looking to post or find an R/data-science job.
Want to share your content on R-bloggers? click here if you have a blog, or here if you don't.