Popularity indicator, with images (NFL)
Want to share your content on R-bloggers? click here if you have a blog, or here if you don't.
It’s Friday night, there’s nothing good on TV, mmm conditions are perfect for shaggin about in R. So I’m an NFL fan, and (shameless plug) avid fan of this NFL podcast. They run their own pickem league which unless users opt out shows their tips in a table. You can eyeball it and get a feel for who picked what, but naturally I wasn’t too fond of just eyeballing the data. So that was my Friday night motivator for this project. At work (among other things) I’m working on using knitr to automate some reports for live reporting of uploaded data, I thought (potentially when polished) the NFL Rants and Raves site could could use this on their pickem site.
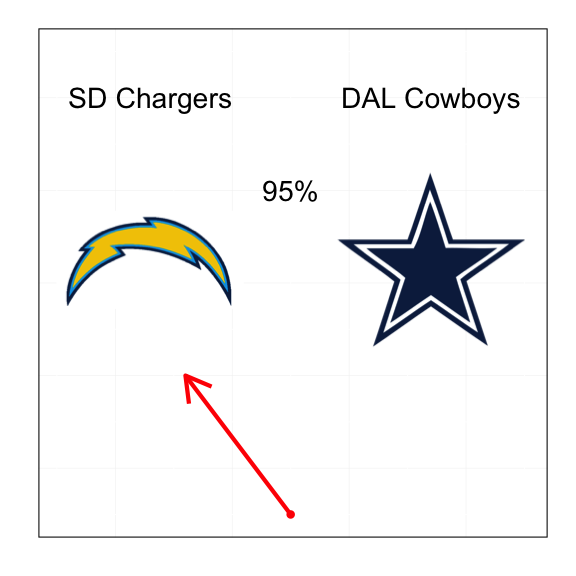
So the idea is to have two images, and have a ‘needle’/arrow showing which preference (distribution) of two things, in this example, percentage who picked which NFL team for the upcoming round. This is far from polished at this point. Thinks I would like to add include: * Having the arrow go in an arch rather than along a line * Having a shaded ‘arch’ under the arrow to show where 0/100% stop * Having the arrow change colour as it points either way * Better fonts (cough comic sans cough) * Ability to create gifs (needle swinging etc) * Flexibility for multi panels (maybe)
Stuff like that, but for now, this is what it looks like.
Set up dummy data
library(png)
library(grid)
library(RCurl)
library(ggplot2)

# pull the logos off the web

char <- readPNG(getURLContent("http://images.wikia.com/halo/images/a/a9/Chargers.png"), TRUE)
char <- rasterGrob(char)
cowb <- readPNG(getURLContent("http://i305.photobucket.com/albums/nn233/13FREAKS/Cowboys.png"), TRUE)
cowb <- rasterGrob(cowb)

# establish team names

teams <- list(SD=list(char,"SD Chargers"),
              DAL=list(cowb,"DAL Cowboys")
)

# the rough plot dimensions where things will sit
df <- data.frame(x=1:100,
                 y=seq.int(40,90,length.out=100)
)

# p that picked the first team
p <- 0.05 # current takes 0-1 as a value and converts the % of team that 'won' (aka always shows as >=50%)

# defining the points for the arrow
df2 <- data.frame(x=c(50,25+50*p),
                  y=c(40,55)
)

# labels to plot above logo

txt <- data.frame(
    label=c(sapply(teams, function(x) x[[2]]),paste0(max(p,1-p)*100,"%")),
    x=c(20,80,50),
    y=c(85,85,75)
)
And here’s the plot
# actual plot
ggplot(df, aes(x=x,y=y)) + geom_blank() +
    annotation_custom(char, xmin=0, xmax=40, ymin=50, ymax=85) +
    annotation_custom(cowb, xmin=60, xmax=100, ymin=50, ymax=85) +
    geom_point(data=df2[1,], aes(x=x,y=y), colour="red", size=4) +
    theme(panel.background=element_blank(),
          axis.line =         element_blank(),
          axis.ticks =        element_blank(),
          axis.ticks.length = unit(0, "cm"),
          axis.text.x =       element_blank(),
          axis.text.y =       element_blank(),
          axis.title.x =       element_blank(),
          axis.title.y =       element_blank(),
          panel.border = element_rect(colour = "black", fill="transparent", size = 1),
          plot.margin = unit(c(1, 1, 1, 1), "cm")
    ) +
    geom_text(data=txt, aes(x=x, y=y, label=label), size=10) +
    geom_segment(data=df2, aes(xend=c(tail(x, n=-1), NA), yend=c(tail(y, n=-1), NA)),
                 arrow=arrow(length=unit(1,"cm")), colour="red", size=2)
Feedback?
I wrote this post in RStudio using the R Markdown language and then knitr to turn in into markdown (.md), and then pandoc to turn it into html. The original file is available here on github.
system(“pandoc -s nfl_team_picker_example.md -o nfl_team_picker_example.html”)
R-bloggers.com offers daily e-mail updates about R news and tutorials about learning R and many other topics. Click here if you're looking to post or find an R/data-science job.
Want to share your content on R-bloggers? click here if you have a blog, or here if you don't.

