Color choosing in R made easy
Want to share your content on R-bloggers? click here if you have a blog, or here if you don't.
I don’t know about you, but when I want to make a graph in R, I handpick the colors, line widths etc… to produce awesome output.
A lot of my time is spent on color choosing, I had to find a more convenient way of doing so. Earl F. Glynn’s “Chart of R colors” posted on http://research.stowers-institute.org/efg/R/Color/Chart/ gave me the idea to the following function.
R has an Internal called colors(), it’s output is a 657 long character vector of reserved names for colors.
The names can be used directly as in :
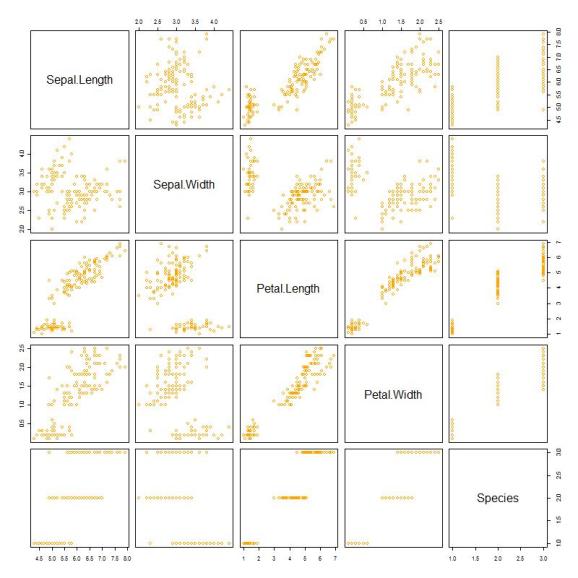
plot(iris,col="orange")
 Alternatively, they can be referred to from colors()
plot(iris,col=colors()[503])
 The color() function has a two arguments (notice it is not plural… I chose this unreserved name because it’s easy to remember) :
- plot.it – FALSE by default
- locate – 0 by default
The call color() is the same as colors().
> color()[555]==colors()[555]
[1] TRUE
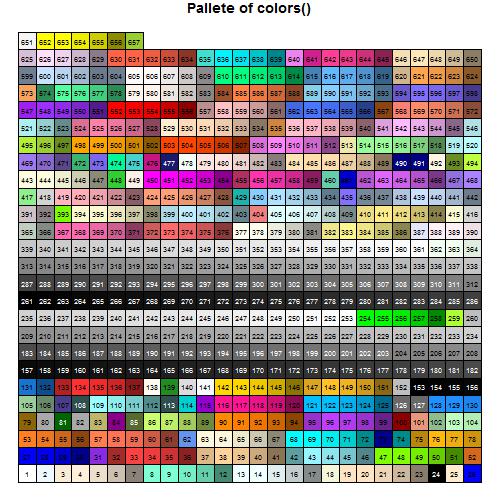
Calling color(plot.it=T) or color(T) gives the following output (very similar to Earl F. Glynn’s “Chart of R colors”) :
You can choose and remember the numbers, or print and stick above your working area… but the following makes color() more useful :
Specifying locate = k > 0 will plot the chart above and this time will use the locator() function in a loop to choose colors you want. After choosing k colors the output will be a k-long character vector of the chosen colors.
> color(T,5)
[1] "firebrick4" "grey9"      "green"      "gray99"     "khaki1"
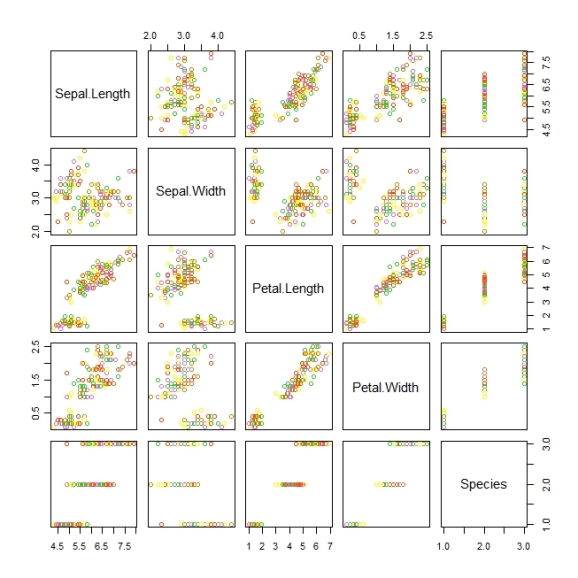
You can use it directly in a plot function, the palette of colors will plot first, choose your colors, the plot you called for will be followed by it:
plot(iris,col=color(T,5))
The function is given by :
color    <- function (plot.it=F,locate=0)
 {
 if(!plot.it)
   {
   return(.Internal(colors())) # so far, not different from colors()
   } # close on if
 else
   {
   ytop    <- rep(seq(1/26,1,by=1/26),each=26)[1:657]
   ybottom <- rep(seq(0,1-1/26,by=1/26),each=26)[1:657]
   xleft   <- rep(seq(0,1-1/26,by=1/26),times=26)[1:657]
   xright  <- rep(seq(1/26,1,by=1/26),times=26)[1:657]
   pall    <- round(col2rgb(colors())/256)
   pall    <- colSums(pall) ; pall2 <- character(0)
   pall2[pall>0]   <- "black"
   pall2[pall==0]  <- "white"

   par(mar=c(0,0,1,0))

   plot.new()
   title(main="Palette of colors()")
   rect(xleft,ybottom,xright,ytop,col=colors())
   text(x=xleft+((1/26)/2)
   ,y=ytop-((1/26)/2)
   ,labels = 1:657
   ,cex=0.55
   ,col=pall2)

   } # close on else
   if(locate==0) print("Palette of colors()")
   else
   {
   colmat    <- matrix(c(1:657,rep(NA,26^2-657)),byrow=T,ncol=26,nrow=26)
   cols        <- NA
   i        <- NA
   for(i in 1:locate)
   {
   h    <- locator(1)
   if(any(h$x<0,h$y<0,h$x>1,h$y>1)) stop("locator out of bounds!")
   else
   {
   cc        <- floor(h$x/(1/26))+1
   rr        <- floor(h$y/(1/26))+1
   cols[i]    <- .Internal(colors())[colmat[rr,cc]]
   } # close on else
   } # close on i
   return(cols)
   } # close on else
   } # close on else+function
You can also write it to variable for further use:
> cols<- color(T,5)
> cols
[1] "magenta"        "orange3"        "palevioletred2" "seagreen4"
[5] "seagreen2"
Of course it’s not perfect, I still have not solved issues of working with Devices such as pdf() jpeg() and such…
Your comments are welcome.
R-bloggers.com offers daily e-mail updates about R news and tutorials about learning R and many other topics. Click here if you're looking to post or find an R/data-science job.
Want to share your content on R-bloggers? click here if you have a blog, or here if you don't.


