
Win Your Snake Draft: Calculating “Value Over Replacement” using R
[This article was first published on Fantasy Football Analytics in R, and kindly contributed to R-bloggers]. (You can report issue about the content on this page here)
Want to share your content on R-bloggers? click here if you have a blog, or here if you don't.
In prior posts, I have demonstrated how to download, calculate, and compare fantasy football projections from ESPN, CBS, and NFL.com and how to calculate players’ risk levels. In this post, I will demonstrate how to win your snake draft so that your team is projected to score the most points.Want to share your content on R-bloggers? click here if you have a blog, or here if you don't.
The Snake Draft
In a snake draft, unlike an auction draft, the team manager has an assigned pick slot, at which point some players will already have been drafted. As a result, a manager has a limited selection of players to choose from, but can choose any player within the remaining pool of players.How to Win Your Snake Draft
The goal is to pick the remaining players at each pick that maximize the team’s sum of projected points for the starting lineup, while minimizing the downside risk of the starters. This is a key point because you will only receive points for who is in your starting lineup for a given week. Having strong bench players does you no good if they stay on the bench. In other words, picking a second quarterback before picking your first wide receiver is not a good idea.An unpublished study by a researcher at Harvard found that the best drafting style was one that: 1) considered a player’s projected points relative to that of a typical replacement player (rather than a player’s number of projected points in absolute terms), and 2) maximized this value for each position in the starting lineup before drafting bench players. I will refer to requirement 1 as value-based drafting, which relies on a metric known as value over replacement player (VORP). I will refer to requirement 2 as starting lineup first.
The premise of value-based drafting is that it’s not enough to consider how many points a player is projected to score, but also how many points a typical player at the same position will score. Assume players A and B are QBs and players C and D are RBs, and that player A is projected to score 300 points and player B (typical replacement) is projected to score 285, while player C is projected to score 200 points and player D (typical replacement) is projected to 100 points. In this example, you might be inclined to pick player A because he is projected to score the most points (300), but the best choice would be player C (200). Why? Because player C is projected to score 100 points more than the typical replacement, whereas player A is projected to score only 15 points more than the typical replacement. In other words, although player A is projected to score more absolute points than player C, player C has higher value (over a replacement). In the remainder of the post, I demonstrate how to calculate a player’s value or VORP.
The R Script
The R script for value-based drafting is located at:https://github.com/dadrivr/FantasyFootballAnalyticsR/blob/master/R%20Scripts/Value%20Over%20Replacement.R
Calculating Value
To calculate a player’s value, we must first calculate the typical or “baseline” replacement player at the same position. Two common ways to determine who is the typical replacement at each position include: a) average starter, b) worst starter, and c) the number of players drafted at each position up to a given point in the draft (e.g., pick 100). I decided to determine the typical replacement as the player whose position rank is equal to the number of players at that position who are taken (on average) by pick 100. There are ways to estimate this with a formula, but I decided to use prior draft information from my league (because each league has different settings in terms of the number of teams, number of starting slots per team, etc.). Specifically, I’ve estimated that by pick 100, about 17 players will be QBs, 35 will be RBs, 35 will be WRs, and 13 will be TEs. To get a more robust estimate of the typical replacement player, I then averaged the number of points from this player at each position with the player of the same position who was ranked 1 above and 1 below the player:#Number of players at each position drafted in Top 100 (adjust for your league) qbReplacements <- 17 rbReplacements <- 35 wrReplacements <- 35 teReplacements <- 13 qbValueOfReplacement <- mean(c(qb$projectedPtsLatent[qb$positionRank==qbReplacements],qb$projectedPtsLatent[qb$positionRank==(qbReplacements-1)],qb$projectedPtsLatent[qb$positionRank==(qbReplacements+1)])) rbValueOfReplacement <- mean(c(rb$projectedPtsLatent[rb$positionRank==rbReplacements],rb$projectedPtsLatent[rb$positionRank==(rbReplacements-1)],rb$projectedPtsLatent[rb$positionRank==(rbReplacements+1)])) wrValueOfReplacement <- mean(c(wr$projectedPtsLatent[wr$positionRank==wrReplacements],wr$projectedPtsLatent[wr$positionRank==(wrReplacements-1)],wr$projectedPtsLatent[wr$positionRank==(wrReplacements+1)])) teValueOfReplacement <- mean(c(te$projectedPtsLatent[te$positionRank==teReplacements],te$projectedPtsLatent[te$positionRank==(teReplacements-1)],te$projectedPtsLatent[te$positionRank==(teReplacements+1)]))
The 6 players with the highest projected points from last year were:
1. Aaron Rodgers (372)
2. Tom Brady (346)
3. Drew Brees (327)
4. Cam Newton (320)
5. Matthew Stafford (313)
6. Arian Foster (306)
The 6 players with the highest value from last year were:
1. Arian Foster (178)
2. Ray Rice (157)
3. Aaron Rodgers (156)
4. LeSean McCoy (137)
5. Tom Brady (129)
6. Calvin Johnson (122)
The differences between the points rankings and value rankings suggest that points rankings over-value QBs. In other words, even if you don't get one of the top scoring QBs, there are numerous other high scoring QBs just below the top tier. This is not the same as with the other positions, where there are fewer options at the top (see figures below). In other words, value rankings are better than points rankings when comparing players across positions.
ggplot(projections[which(projections$vor >= 0),], aes(x=vor, fill=pos)) + geom_density(alpha=.3) + xlab("Player's Value Over Replacement") + ggtitle("Density Plot of Projected VOR from 2012") + theme(legend.title=element_blank())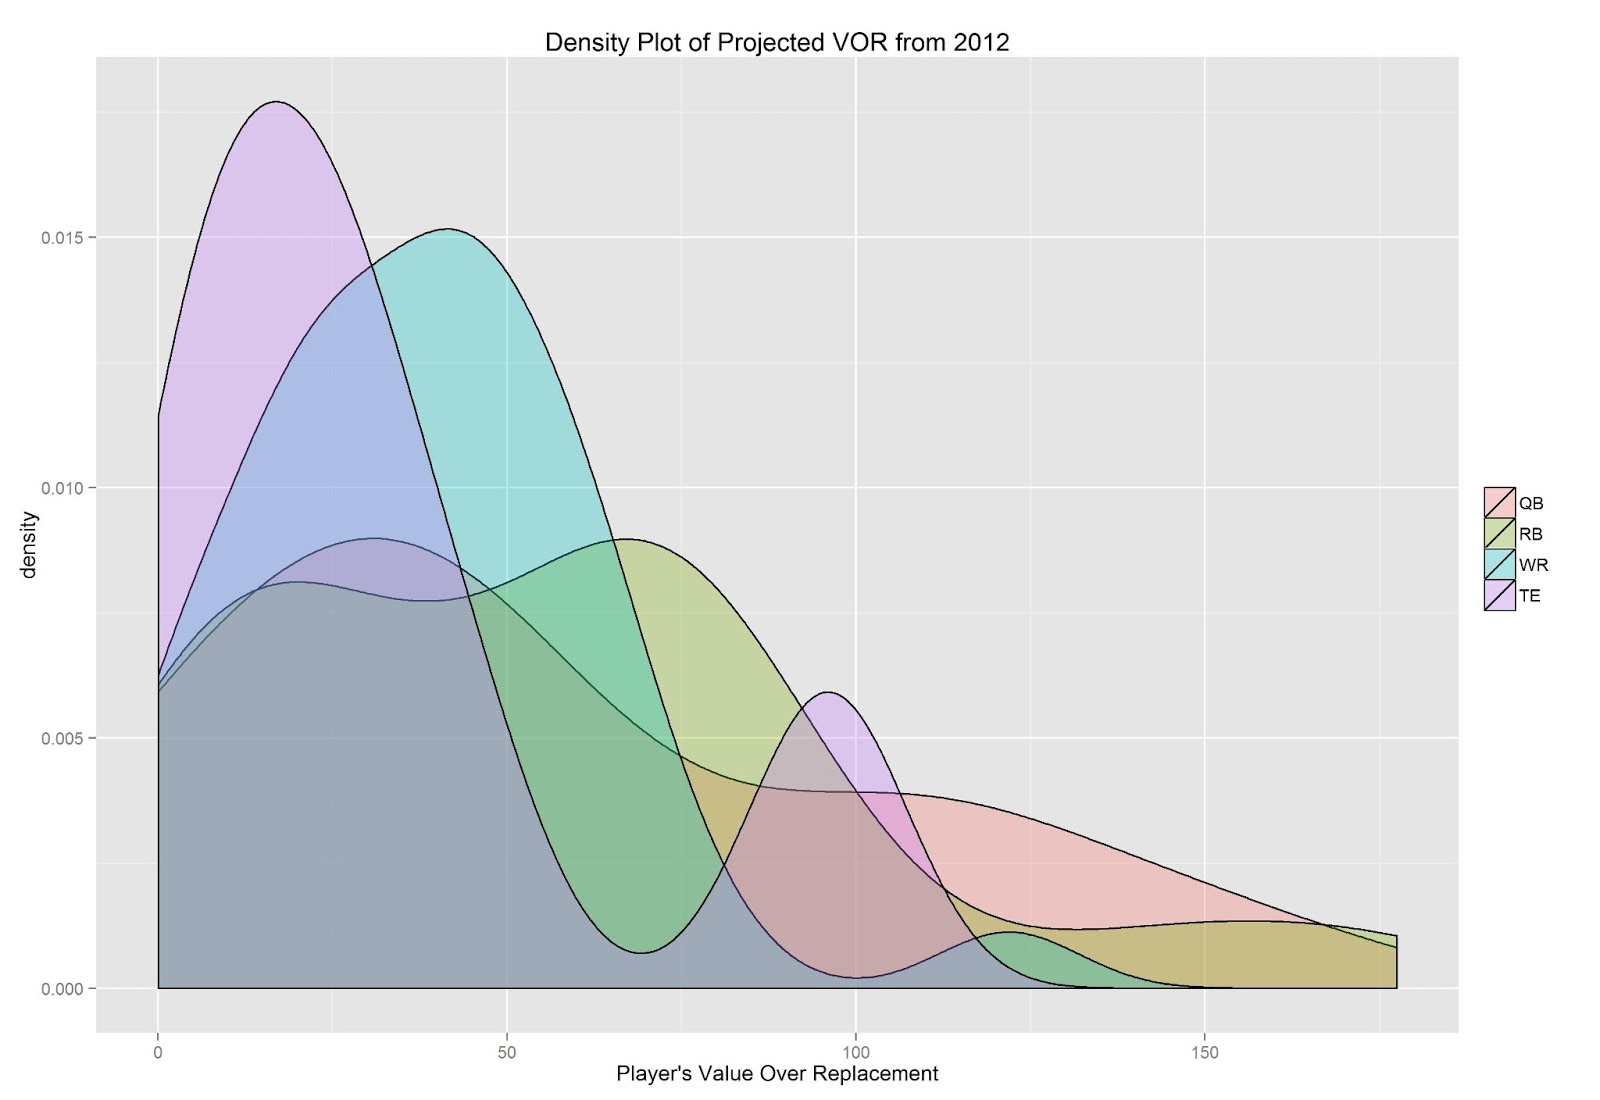
qplot(pos, vor, data=projections[which(projections$vor >= 0),], geom=c("boxplot", "jitter"), fill=pos, main="Value Over Replacement By Position", xlab="", ylab="Value Over Replacement")
The R script also includes a section where, on draft day, you can specify the names of players that have been drafted, and it will show you the remaining available players ranked by value:
drafted <- c("Arian Foster","Ray Rice")

draftData[!(draftData$name %in% drafted),]
As was demonstrated in my prior post, though, it is also important to consider a player's risk level. Specifically, you should pick starters with a low risk level, whereas you should pick bench players with a higher risk level. We can view these subgroups of players (starters versus sleepers) with the following R commands:#Starters (low risk) draftData[!(draftData$name %in% drafted) & draftData$risk <=4,] #Sleepers (high risk) draftData[!(draftData$name %in% drafted) & draftData$risk >=6,]
Conclusion
In conclusion, there are 3 guidelines to win your snake draft:
The R script accompanying this post calculates players' values and allows you to sort low- and high-risk players by value and to remove drafted (unavailable) players.
In subsequent posts, I will demonstrate how to win your auction draft by maximizing your team's projected points and minimizing its downside risk.
- Draft your offensive starting lineup first before drafting bench players.
- For starters, pick the player with the highest value (over a typical replacement) who has low risk.
- For bench players, pick the player with the highest value (over a typical replacement) who has high risk.
The R script accompanying this post calculates players' values and allows you to sort low- and high-risk players by value and to remove drafted (unavailable) players.
In subsequent posts, I will demonstrate how to win your auction draft by maximizing your team's projected points and minimizing its downside risk.
To leave a comment for the author, please follow the link and comment on their blog: Fantasy Football Analytics in R.
R-bloggers.com offers daily e-mail updates about R news and tutorials about learning R and many other topics. Click here if you're looking to post or find an R/data-science job.
Want to share your content on R-bloggers? click here if you have a blog, or here if you don't.