
Visualizing asylum statistics
Want to share your content on R-bloggers? click here if you have a blog, or here if you don't.
Note: of potential interest to R users for the dynamic Google chart generated via googleVis in R and discussed towards the end of the post. Here you can go directly to the graph.
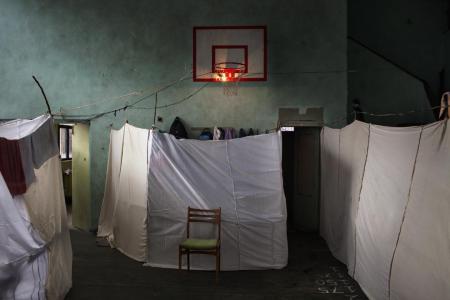
An emergency refugee center, opened in September 2013 in an abandoned school in Sofia, Bulgaria. Photo by Alessandro Penso, Italy, OnOff Picture. First prize at World Press Photo 2013 in the category General News (Single).
The tragic lives of asylum-seekers make for moving stories and powerful photos. When individual tragedies are aggregated into abstract statistics, the message gets harder to sell. Yet, statistics are arguably more relevant for policy and provide for a deeper understanding, if not as much empathy, than individual stories. In this post, I will offer a few graphs that present some of the major trends and patterns in the numbers of asylum applications and asylum recognition rates in Europe over the last twelve years. I focus on two issues: which European countries take the brunt of the asylum flows, and the link between the application share that each country gets and its asylum recognition rate.
Asylum applications and recognition rates
Before delving into the details, let’s look at the big picture first. Each year between 2001 and 2012, 370,000 people on average have applied for asylum protection in one of the member states of the European Union (plus Norway and Switzerland). As can be seen from Figure 1, the number fluctuates between 250,000 and 500,000 per year, and there is no clear trend. Altogether, during this 12-year period, approximately 4.5 million people have applied for asylum, which makes slightly less than one percent of the total EU population. Of course, this figure only tracks people who have actually made it to the asylum centers and filed an application – all potential refugees who have perished on the way, or have arrived but been denied the right of formal application, or have remained clandestine are not counted.

Figure 1 also shows the annual number of persons actually recognized as ‘refugees’ under the terms of the Geneva Convention by the European governments: a status which grants considerable rights and protection. This number is quite lower with an average of around 40.000 per year (in the EU+ as a whole) which makes for less than half-a-million in total for the 12 years between 2001 and 2012. While the overall recognition rate remains between 7% and 14%, there is considerable variation between the different European states both in the share from the asylum flows they receive, and in the national asylum recognition rates.
Who takes the brunt of the asylum burden?
Both the asylum flows and the recognition rates are in fact distributed highly unequally across the continent, and in a way that cannot be completely accounted for by the wealth of destination countries, former (colonial) ties between asylum sources and destinations, nor geographical distance. To compare the shares of the total European pool of asylum applications and recognitions that a destination country gets, I create the so-called ‘burden coefficient’. The ‘burden coefficient’ compares the actual share of asylum applications a country received in a year to its ‘fair’ share which is defined as its relative share of the annual total EU+ GDP. Simply put, if a country accounts for 10% of the European GDP, it would have been expected to receive 10% of all asylum applications filed in Europe that year. Taking account of GDP adjusts the raw asylum application shares in view of the expectation that richer and more populous countries should bear a proportionally higher share of the total European asylum ‘burden’ than poorer and smaller states.

Figure 2 shows the (logged) burden coefficient for asylum application shares for each EU+ country, averaged over the period 2010-2012. The solid line at zero indicates an asylum applications share perfectly proportional to a country’s GDP share (a ‘fair’ burden). Countries with positive values receive a higher share of all applications than implied by their GDP level, and countries with negative values receive a lower than their implied share. (The dotted lines show where a country that is doing twice as much / twice as little as expected would be). Clearly, Spain, Portugal, Italy and many (but not all) of the East European countries underdeliver while Cyprus, Malta, Greece, and several West European states (notably Sweden, Belgium, and Norway) take a disproportionately high share of the total pool of asylum applications filed in Europe over the last few years. Note that these comparisons already take into account (correct for) the fact that most of the Southern and Eastern European countries are poorer (have lower GDP) than the ones in the Western and Northern parts of the continent.

The picture does not change much when we focus on actual asylum recognitions (under the terms of the Geneva Convention) instead of applications. Figure 3 shows the burden coefficient (again averaged over 2010-2012) for full status refugee recognitions in Europe. The country ranking is similar with a few important exception – Greece grants much fewer asylum recognitions than expected even after we account for the state of its economy; Austria and Switzerland join the ranks of states which do much more than their implied share; and, sadly, many more countries in fact underdeliver when it comes to full refugee status grants. (Note that some states offer alternative protection to those denied the full ‘Geneva Convention’ status but the forms and level of this protection differs significantly across the continent).
Are asylum application shares responsive to the recognition rate?
Given these rather significant discrepancies across Europe in how many asylum applications countries get, and how much protection they offer, it is natural to ask whether the applications shares and the recognition rates are in fact related. Do asylum seekers flock at the gates of the European states which are most generous in their recognition policy? Do low recognition rates deter potential refugees from applying in certain countries? Can the strictness of asylum policy be an effective policy tool shaping future application flows? A comprehensive statistical analysis shows that while application shares and recognition rates are associated, their responsiveness to each other is rather weak. Simply put, manipulating the recognition rates is unlikely to have big practical effects on the asylum application share a country receives, and changes in the applications rates only weakly affect state recognition rates. The details of the analysis are rather technical and can be found here, but a dynamic visualization can help illustrate the patterns.
The dynamic interactive chart linked here shows the relationship between asylum applications and asylum recognition rates for each EU+ country over the last 12 years (the chart cannot be embedded in this post due to WordPress policy, but there is a screenshot below). When you press ‘Play’ each dot traces the experience of one country over time. You can choose to observe all, select a single state to focus upon, or tick a couple to compare their experiences.

A movement of a dot (and the trace in leaves) in a horizontal direction means that the number of asylum applications received by a country increases while the recognition rates remains the same. Similarly, a vertical move implies a change in the recognition rate but a stable asylum application flow. A trajectory that follows a diagonal suggests a link between applications and recognition rates.
When paused, the state of the chart at each year shows the cross-sectional association between applications and recognition rates: it is easy to see that there is a (rather stable) weakly-strong positive relationship. But the trajectories of individual countries over time do not suggest that there is a temporal link between the two aspects of asylum policy for particular countries. For example, in the UK between 2001 and 2004 both the recognition rates and the applications fall, which would suggest strong responsiveness, but then the recognition rate moves up from 4% to almost 30% without any significant increase in applications. The trajectory of Denmark (try it out) exhibits something close to a dynamic link with rates depressing applications initially but then when they rise again, applications seem to pick up as well. Of course, asylum flows are driven by many other factors as well, so while suggestive, the patterns in the chart should be interpreted with care.

More comprehensive analyses of asylum policy in Europe addressing these questions and more are available in my published articles accessible here and here. The original data comes from the UNHCR annual reports. The dynamic chart is generated using Google Chart Tools through the googleVis library in R, you can find the code here. I found it useful to generate a simple version, adjust the settings manually, and then copy the final settings via the Google Chart’s Advanced Panel back to R.

R-bloggers.com offers daily e-mail updates about R news and tutorials about learning R and many other topics. Click here if you're looking to post or find an R/data-science job.
Want to share your content on R-bloggers? click here if you have a blog, or here if you don't.