
Using sentiment analysis to predict ratings of popular tv series
Want to share your content on R-bloggers? click here if you have a blog, or here if you don't.
Unless you’ve been living under a rock for the last few years, you have probably heard of TV shows such as Breaking Bad, Mad Men, How I Met Your Mother or Game of Thrones. While I generally don’t spend a whole lot of time watching TV, I have also undergone some pretty intense binge-watching sessions in the past (they generally coincided with exam periods, which was actually not a coincidence…). As I was watching the epic final season of Breaking Bad, it got me thinking on how TV series compare to one another, and how their ratings evolve over time. I therefore decided to look a bit further into user rating trends of popular TV series (and by popular I mean the ones I know). For this, I simply had to define a quick scraping function in R that retrieves the average IMDB user ratings assigned to each episode of a given series.
'scrape_ratings' <- function(url)
{
  require(XML)
  # get HTML of url
  doc <- htmlParse(url)

  # find all tables in webpage
  tables <- readHTMLTable(doc)

  # find largest table and return as dataframe
  nrows <- unlist(lapply(tables, function(t) dim(t)[1]))
  df <- tables[[which.max(nrows)]]

  return(df)
}

# IMDB id of Breaking Bad is "tt0903747"
url <- 'http://www.imdb.com/title/tt0903747/epdate'
series.ratings <- scrape_ratings(url)
After some minor data cleaning, I was able to plot the evolution of IMDB user ratings for some of the most popular TV series. Breaking Bad looks like the highest rated series, followed closely by Game of Thrones. It is also interesting to note the big drop in ratings for shows such as Family Guy, South Park and How I Met Your Mother. The same goes for the Simpsons, who (I’ve been told) used to be excellent and are now much less fun to watch.

Since I’ve recently taken an interest in NLP and some of the challenges associated with it, I also decided to perform a sentiment analysis of the TV series under study. In this case, we can use the AFINN list of positive and negative words in the English language, which provides 2477 words weighted in a range of [-5, 5] according to their “negativeness” or “positiveness”. For example, the phrase below would be scored as -3 (terrible) -2 (mistake) + 4 (wonderful) = -1
"There is a terrible mistake in this work, but it is still wonderful!"
I used a Python scraper (for any midly sophisticated scraping purposes, the BeautifulSoup Python library still has no equal in R) to retrieve the transcripts of all episodes in each TV series and computed their overall sentiment score, which produced the figure below. Here, the higher the sentiment score, the more “positive” was the episode, and vice-versa.

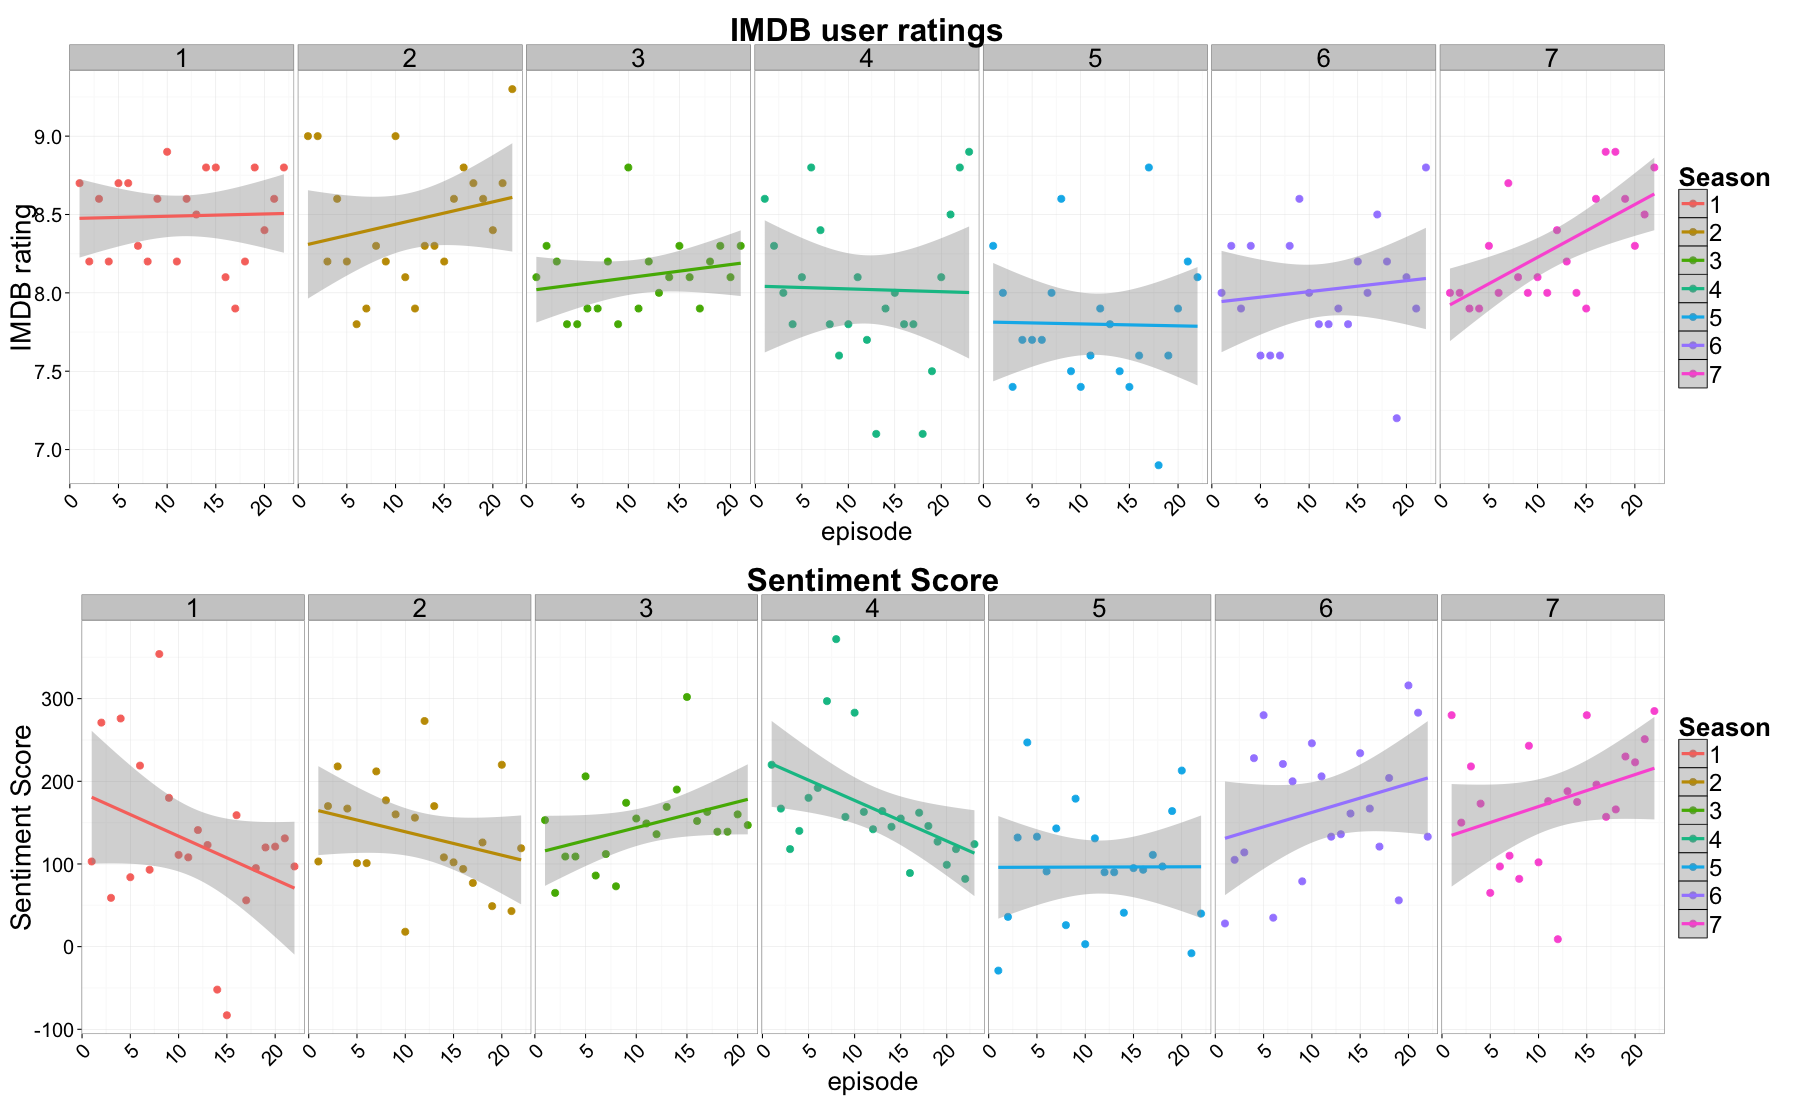
Of the TV series featured here, we can see that Game of Thrones is by far the most negative of them all, which is not surprising given the plotting, killing and general all out warring that goes on in this show. On the flip side, Glee was the most positive TV series, which also makes a lot sense, given how painfully corny it can be. Of the shows that have already ended (Friends, West Wing and Grey’s anatomy), It is interesting to observe a progressive rise of positiveness as we get closer to the final episode, presumably because the writers try and end the series on a high note. I have included more detailed graphs of the rating and sentiments for each TV series at the bottom of this post.
Looking at the plot above, we can wonder whether user ratings are somehow dependent on the sentiments of a given episode. We can investigate this further by fitting a simple model in which the response is the IMDB user ratings, and predictor variables are sentiment, number of submitted votes, and TV series.
sentiment rating   VoteCount series
148       8.4      2352      BBT
61        8.4      1691      Breaking Bad
115       7.9      1418      BBT
109       8.2      1458      Game of Thrones
194       8.1      1356      Simpsons
131       8.5      1406      Simpsons
For the purpose of this study, I considered two types of model: multiple regression and MARS (Multivariate Adaptive Regression Splines, implemented in the earth R package), and assessed their performance using 10-fold cross-validation. Below is a plot of the root mean squared error scored by both method at each fold.
 MARS appears to perform better, which is likely due to the fact that it is designed to capture non-linear and interaction effects. Overall, we see that MARS does a good job of predicting user ratings of episodes based off its overall sentiment, as the difference between true rating and predicted rating is normally distributed around zero and has relatively standard deviation.

In conclusion, while this is a relatively unrigorous study, it appears that we can predict with reasonable accuracy the average IMDB user ratings that will be assigned to an episode, so long as we know its overall sentiment score and the number of submitted votes. Of course, we could probably obtain far better accuracy if we could account for other elements such a humor, suspense and so on. Furthermore, we could extend this to predict individual user ratings rather than the average, which would ultimately make more sense since people tend to respond differently to TV series (although it would be interesting to actually confirm that). You can scroll down to look at more detailed plots of user ratings and sentiment analysis for different popular TV series. As usual, all the relevant code can be found on my GitHub account.
Big Bang Theory

Breaking Bad

Family Guy

Friends

Glee

Game of Thrones

Grey’s Anatomy

How I Met Your Mother

Mad Men

Sex in the City

Simpsons

South Park

West Wing

R-bloggers.com offers daily e-mail updates about R news and tutorials about learning R and many other topics. Click here if you're looking to post or find an R/data-science job.
Want to share your content on R-bloggers? click here if you have a blog, or here if you don't.