
The Paul Tol 21-color salute
Want to share your content on R-bloggers? click here if you have a blog, or here if you don't.
You may or may not know that PerformanceAnalytics contains a number of specific color schemes designed for charting data in R (they aren’t documented well, but they show up in some of the chart examples). I’ve been collecting color palates for years in search of good combinations of attractiveness, relative weight, and distinctiveness, helped along the way by great sites like ColorBrewer and packages like RColorBrewer. I’ve assembled palettes that work for specific purposes, such as the color-focus palates (e.g., redfocus is red plus a series of dark to light gray colors). Others, such as rich#equal, provide a palette for displaying data that all deserve equal treatment in the chart. Each of these palettes have been designed to create readable, comparable line and bar graphs with specific objectives outlined before each category below.
I use this approach rather than generating schemes on the fly for two reasons: it creates fewer dependencies on libraries that don’t need to be called dynamically; and to guarantee the color used for the n-th column of data.
Oh, and here’s a little utility function (that I don’t think I wroteEDIT: that I know I didn’t write, since it was written by Achim Zeileis and is found in his colorspace package, but I have carried it around for quite a while) for displaying a palette:
# Function for plotting colors side-by-side
pal <- function(col, border = "light gray", ...){
  n <- length(col)
  plot(0, 0, type="n", xlim = c(0, 1), ylim = c(0, 1),
       axes = FALSE, xlab = "", ylab = "", ...)
  rect(0:(n-1)/n, 0, 1:n/n, 1, col = col, border = border)
}
The Focus palettes are colorsets designed to provide focus to the data graphed as the first element. These palettes are best used when there is clearly an important data set for the viewer to focus on, with the remaining data being secondary, tertiary, etc. Later elements are shown in diminishing values of gray. These were generated with RColorBrewer, using the 8 level “grays” palette and replacing the darkest gray with the focus color.
# FOCUS PALETTES
# Red as highlight
redfocus = c("#CB181D", "#252525", "#525252", "#737373", "#969696", "#BDBDBD", "#D9D9D9", "#F0F0F0")

# Green as highlight
greenfocus = c("#41AB5D", "#252525", "#525252", "#737373", "#969696", "#BDBDBD", "#D9D9D9", "#F0F0F0")

# Blue as highlight
bluefocus = c("#0033FF", "#252525", "#525252", "#737373", "#969696", "#BDBDBD", "#D9D9D9", "#F0F0F0")

pal(greenfocus)

Equal Weight palettes colorsets are fine for when all of the data should be distinguishable and carry similar weight, such as on a line graph or bar plot. The different numbers in the name indicate the number of colors generated (six colors is probably the maximum for a completely readable linegraph).
# EQUAL WEIGHT
# Generated with rainbow(12, s = 0.6, v = 0.75)
rainbow12equal = c("#BF4D4D", "#BF864D", "#BFBF4D", "#86BF4D", "#4DBF4D", "#4DBF86", "#4DBFBF", "#4D86BF", "#4D4DBF", "#864DBF", "#BF4DBF", "#BF4D86")
rainbow10equal = c("#BF4D4D", "#BF914D", "#A8BF4D", "#63BF4D", "#4DBF7A", "#4DBFBF", "#4D7ABF", "#634DBF", "#A84DBF", "#BF4D91")
rainbow8equal = c("#BF4D4D", "#BFA34D", "#86BF4D", "#4DBF69", "#4DBFBF", "#4D69BF", "#864DBF", "#BF4DA3")
rainbow6equal = c("#BF4D4D", "#BFBF4D", "#4DBF4D", "#4DBFBF", "#4D4DBF", "#BF4DBF")

# Generated with package "gplots" function rich.colors(12)
rich12equal = c("#000040", "#000093", "#0020E9", "#0076FF", "#00B8C2", "#04E466", "#49FB25", "#E7FD09", "#FEEA02", "#FFC200", "#FF8500", "#FF3300")
rich10equal = c("#000041", "#0000A9", "#0049FF", "#00A4DE", "#03E070", "#5DFC21", "#F6F905", "#FFD701", "#FF9500", "#FF3300")
rich8equal = c("#000041", "#0000CB", "#0081FF", "#02DA81", "#80FE1A", "#FDEE02", "#FFAB00", "#FF3300")
rich6equal = c("#000043", "#0033FF", "#01CCA4", "#BAFF12", "#FFCC00", "#FF3300")

# Generated with package "fields" function tim.colors(12), which is said to emulate the default matlab colorset
tim12equal = c("#00008F", "#0000EA", "#0047FF", "#00A2FF", "#00FEFF", "#5AFFA5", "#B5FF4A", "#FFED00", "#FF9200", "#FF3700", "#DB0000", "#800000")
tim10equal = c("#00008F", "#0000FF", "#0070FF", "#00DFFF", "#50FFAF", "#BFFF40", "#FFCF00", "#FF6000", "#EF0000", "#800000")
tim8equal = c("#00008F", "#0020FF", "#00AFFF", "#40FFBF", "#CFFF30", "#FF9F00", "#FF1000", "#800000")
tim6equal = c("#00008F", "#005AFF", "#23FFDC", "#ECFF13", "#FF4A00", "#800000")

# Generated with sort(brewer.pal(8,"Dark2")) #Dark2, Set2
dark8equal = c("#1B9E77", "#666666", "#66A61E", "#7570B3", "#A6761D", "#D95F02", "#E6AB02", "#E7298A")
dark6equal = c("#1B9E77", "#66A61E", "#7570B3", "#D95F02", "#E6AB02", "#E7298A")
set8equal = c("#66C2A5", "#8DA0CB", "#A6D854", "#B3B3B3", "#E5C494", "#E78AC3", "#FC8D62", "#FFD92F")
set6equal = c("#66C2A5", "#8DA0CB", "#A6D854", "#E78AC3", "#FC8D62", "#FFD92F")

pal(rich8equal)

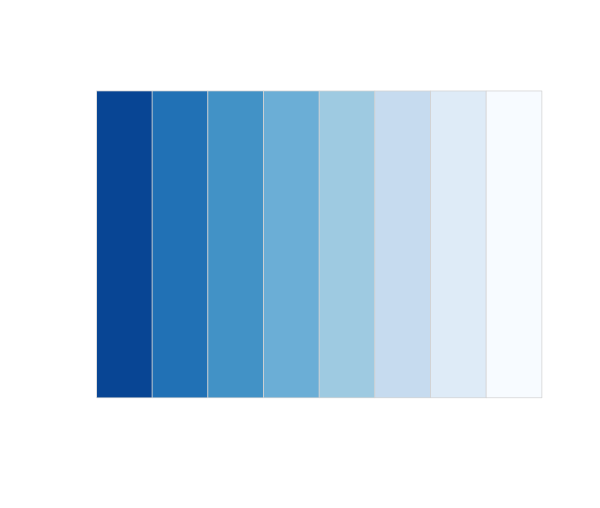
The last category are Monochrome palettes, which I like in both stacked bar plots and with a few lines.
# MONOCHROME PALETTES
# sort(brewer.pal(8,"Greens"))
redmono = c("#99000D", "#CB181D", "#EF3B2C", "#FB6A4A", "#FC9272", "#FCBBA1", "#FEE0D2", "#FFF5F0")
greenmono = c("#005A32", "#238B45", "#41AB5D", "#74C476", "#A1D99B", "#C7E9C0", "#E5F5E0", "#F7FCF5")
bluemono = c("#084594", "#2171B5", "#4292C6", "#6BAED6", "#9ECAE1", "#C6DBEF", "#DEEBF7", "#F7FBFF")
grey8mono = c("#000000","#252525", "#525252", "#737373", "#969696", "#BDBDBD", "#D9D9D9", "#F0F0F0")
grey6mono = c("#242424", "#494949", "#6D6D6D", "#929292", "#B6B6B6", "#DBDBDB")

pal(bluemono)
A while ago I decided that none of these schemes was quite discernable enough for what I needed to do. I frequently display line graphs that require the reader to differentiate among the colors, and sometimes I need more differentiable colors than is advisable. I did a bit of hunting around and came across Paul Tol’s SRON Technical Note and have since been using his color schemes for qualitative data, which are nicely distinctive and come with more combinations than many of the best ColorBrewer sets.
# Qualitative color schemes by Paul Tol
 tol1qualitative=c("#4477AA")
 tol2qualitative=c("#4477AA", "#CC6677")
 tol3qualitative=c("#4477AA", "#DDCC77", "#CC6677")
 tol4qualitative=c("#4477AA", "#117733", "#DDCC77", "#CC6677")
 tol5qualitative=c("#332288", "#88CCEE", "#117733", "#DDCC77", "#CC6677")
 tol6qualitative=c("#332288", "#88CCEE", "#117733", "#DDCC77", "#CC6677","#AA4499")
 tol7qualitative=c("#332288", "#88CCEE", "#44AA99", "#117733", "#DDCC77", "#CC6677","#AA4499")
 tol8qualitative=c("#332288", "#88CCEE", "#44AA99", "#117733", "#999933", "#DDCC77", "#CC6677","#AA4499")
 tol9qualitative=c("#332288", "#88CCEE", "#44AA99", "#117733", "#999933", "#DDCC77", "#CC6677", "#882255", "#AA4499")
 tol10qualitative=c("#332288", "#88CCEE", "#44AA99", "#117733", "#999933", "#DDCC77", "#661100", "#CC6677", "#882255", "#AA4499")
 tol11qualitative=c("#332288", "#6699CC", "#88CCEE", "#44AA99", "#117733", "#999933", "#DDCC77", "#661100", "#CC6677", "#882255", "#AA4499")
 tol12qualitative=c("#332288", "#6699CC", "#88CCEE", "#44AA99", "#117733", "#999933", "#DDCC77", "#661100", "#CC6677", "#AA4466", "#882255", "#AA4499")

pal(tol7qualitative)

A recent update to Paul’s technical paper adds a new banded rainbow scheme, and several have a large number of steps. He notes that when you’re using them you’re better off picking a scheme that matches the number of colors needed, rather than using only a few colors from a larger scheme.
tol14rainbow=c("#882E72", "#B178A6", "#D6C1DE", "#1965B0", "#5289C7", "#7BAFDE", "#4EB265", "#90C987", "#CAE0AB", "#F7EE55", "#F6C141", "#F1932D", "#E8601C", "#DC050C")
tol15rainbow=c("#114477", "#4477AA", "#77AADD", "#117755", "#44AA88", "#99CCBB", "#777711", "#AAAA44", "#DDDD77", "#771111", "#AA4444", "#DD7777", "#771144", "#AA4477", "#DD77AA")
tol18rainbow=c("#771155", "#AA4488", "#CC99BB", "#114477", "#4477AA", "#77AADD", "#117777", "#44AAAA", "#77CCCC", "#777711", "#AAAA44", "#DDDD77", "#774411", "#AA7744", "#DDAA77", "#771122", "#AA4455", "#DD7788")
# ...and finally, the Paul Tol 21-color salute
tol21rainbow= c("#771155", "#AA4488", "#CC99BB", "#114477", "#4477AA", "#77AADD", "#117777", "#44AAAA", "#77CCCC", "#117744", "#44AA77", "#88CCAA", "#777711", "#AAAA44", "#DDDD77", "#774411", "#AA7744", "#DDAA77", "#771122", "#AA4455", "#DD7788")

pal(tol21rainbow)

Ok, I admit that 21 colors is pushing it when it comes to discernability on the screen or page. But sometimes there are too many lines anyway and you need to try to show them all. So this is a nice set to pull from your back pocket before reverting to a continuous series.
I’d be curious if you’ve found a color scheme you like – if so, add it to the comments…

R-bloggers.com offers daily e-mail updates about R news and tutorials about learning R and many other topics. Click here if you're looking to post or find an R/data-science job.
Want to share your content on R-bloggers? click here if you have a blog, or here if you don't.