
Shiny-based Online Tool for X-13 Seasonal Adjustment: New Features
Want to share your content on R-bloggers? click here if you have a blog, or here if you don't.
The R package seasonal makes it easy to use X-13ARIMA-SEATS, the seasonal adjustment software by the U.S. Census Bureau. In a previous post, I wrote about www.seasonal.website, a Shiny-based website showcasing the use of seasonal. Even if you are not using R, the website allows you to upload and adjust your own series, without the need for any software installation.
The latest version of www.seasonal.website comes with several new features:
Live Parsing of X-13 spc Files
The main new feature is a live parser of X-13 spc files. Changes in the Options, triggered by the pull-down menus, or changes in the R Call, are reflected in an updated X-13 Call. On the other hand, changes in the X-13 Call will be reflected by updates in the Options and the R Call.

Interactively manipulate the X-13 spec file or the R call
This brings interesting new possibilities:
- Non-R-users may use the website to generate spc files, which they can use in any software that includes X-13ARIMA-SEATS.
- People familiar with X-13 may use the spc syntax to learn about the syntax of the R-package seasonal.
- People familiar with the R-package seasonal may use it learn about the spc syntax.
New Upload/Download Dialog
The upload/download feature has been reworked. A button on the top-right corner opens a new upload and download dialog.
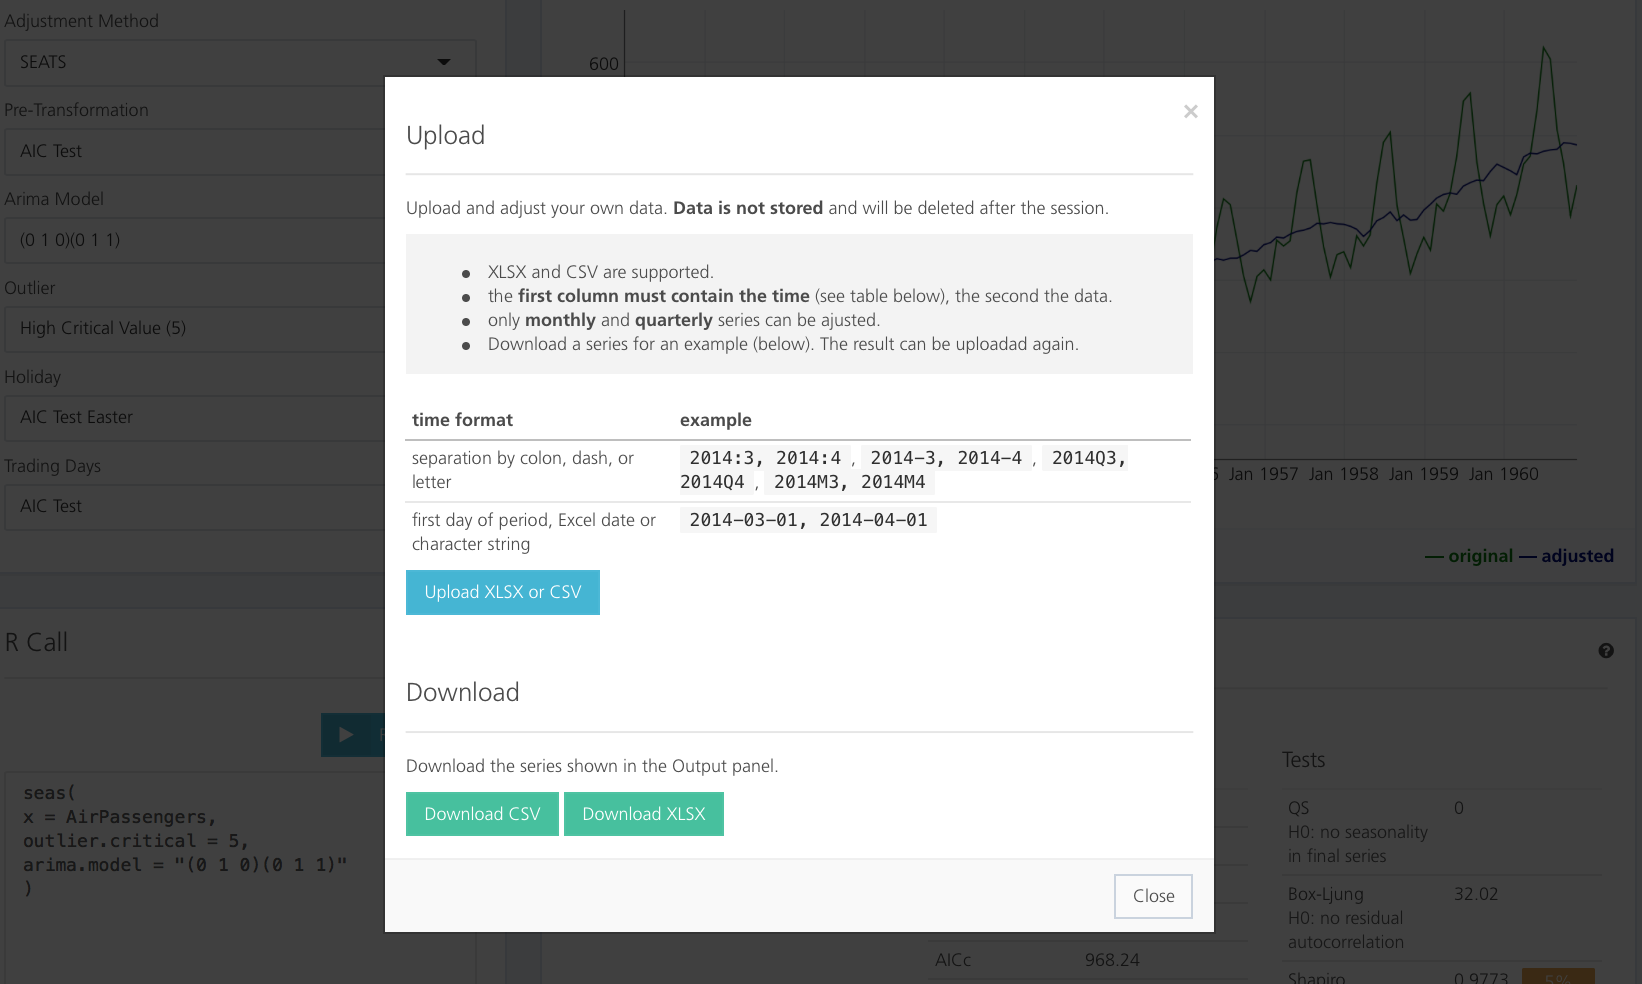
New upload/download dialog
Both XLSX and CSV formats are supported. You can upload and adjust your own monthly or quarterly time series. All data will be permanently deleted after your session.
Nice Summary
The summary, previously just the printed output of the R-function summary, has been overhauled. Colored flags indicate the significance level of the coefficients, reddish colors indicate warning signs from the tests.

New Summary

R-bloggers.com offers daily e-mail updates about R news and tutorials about learning R and many other topics. Click here if you're looking to post or find an R/data-science job.
Want to share your content on R-bloggers? click here if you have a blog, or here if you don't.