
Response Time Percentiles for Multi-server Applications
Want to share your content on R-bloggers? click here if you have a blog, or here if you don't.
More importantly, that analysis was for a single server application (viz., time-to-first-fix latency). At the end of my post, I hinted at adding percentiles to PDQ for multi-server applications. Here, I present the corresponding rules-of-thumb for the more ubiquitous multi-server applications.
Single-server Percentiles
First, let’s summarize the Guerrilla rules-of-thumb for single-server percentiles (M/M/1 in queueing parlance): \begin{align} R_{1,80} &\simeq \dfrac{5}{3} \, R_{1} \label{eqn:mm1r80}\\ R_{1,90} &\simeq \dfrac{7}{3} \, R_{1}\\ R_{1,95} &\simeq \dfrac{9}{3} \, R_{1} \label{eqn:mm1r95} \end{align} where $R_{1}$ is the statistical mean of the measured or calculated RT and $\simeq$ denotes approximately equal. A useful mnemonic device is to notice the numerical pattern for the fractions. All denominators are 3 and the numerators are successive odd numbers starting with 5.Multi-server Percentiles
A multi-server analysis (M/M/m in queueing parlance) can be applied to such things as application servers, like Weblogic or Websphere. The corresponding percentile approximations are a bit more complicated in that they involve two terms and require knowing not just the mean of the RT $R_{m}$, but also the standard deviation $R_{sd}$. \begin{align} R_{m,80} &\simeq R_{m} + \dfrac{2}{3} R_{sd} \label{eqn:mm8r80}\\ R_{m,90} &\simeq R_{m} + \dfrac{4}{3} R_{sd}\\ R_{m,95} &\simeq R_{m} + \dfrac{6}{3} R_{sd} \label{eqn:mm8r95} \end{align} The factions are now applied to the standard deviation term, not the mean. Their numerical pattern is also slightly different from the single-server case in that the numerators are successive even numbers starting with 2. This difference arises from the fact that equations $\eqref{eqn:mm1r80}$—$\eqref{eqn:mm1r95}$ can be rewritten as: \begin{align} R_{1,80} &\simeq \dfrac{3}{3} \, R_{1} + \dfrac{2}{3} R_{sd} \nonumber \\ R_{1,90} &\simeq \dfrac{3}{3} \, R_{1} + \dfrac{4}{3} R_{sd} \nonumber \\ R_{1,95} &\simeq \dfrac{3}{3} \, R_{1} + \dfrac{6}{3} R_{sd} \nonumber \end{align}In the case of an M/M/1 queue, however, the standard deviation of the RT is identical to the mean of the RT (i.e., $R_{sd} = R_{1}$), so these equations reduce to $\eqref{eqn:mm1r80}$—$\eqref{eqn:mm1r95}$. This simplification is not possible for an M/M/m queue.
Example: 8-Way Server
To establish the validity of equations $\eqref{eqn:mm8r80}$—$\eqref{eqn:mm8r95}$, I built a simulation of an 8-way server, i.e., M/M/8, that assumes exponential arrival and service periods. The throughput was set to 40 requests per second with a service rate of 6 requests per second. That makes each server 83.33% busy. The simulation was run for a million time-steps with the RT logged for each request. This produced more than 650,000 raw data samples, which were then analyzed using the following R code.
# Fast read of near 1-million log file
require(data.table)
system.time(dt <- fread("/Users/.../logfile.data"))
df <- as.data.frame(dt)
Next, we need to determine the time spent in the multi-server by taking the difference between the arrival time and the departure time. In other words, we need to find each pair of times belonging to the same request id. The simplest logic in R is something like this:
deltaR <- 0 # residence time per request
for(j in 0:maxpair) {
 rowz <- which(df$JOB_ID == j)
 deltaR[j+1] <- df$TIMESTAMP[rowz[2]] -
                 df$TIMESTAMP[rowz[1]]
}
but you need to know maximum request ID that has a corresponding pair. Even worse, because of the way which() has to span the data frame, this code took more than 15 minutes on a quad-core Macbook Air with 8 GB of RAM. I was able to gain a 5x speedup by first sorting the data using the request ID to produce adjacent pairs and then simply alternating over these pairs.
# sort job IDs into pairs
df <- df[order(df$JOB_ID),]
# re-index sorted rows
dfs <- data.frame(df$LOGGERNAME,df$TIMESTAMP,df$JOB_ID)
deltaR <- 0 # residence time per request
i      <- 1 # sample counter
time1 <- TRUE
for(row in 1:dim(df)[1]) {
 if(time1) {
  t1  <- df$TIMESTAMP[row]
  id1 <- df$JOB_ID[row]
  time1 <- FALSE
 } else {
  id2 <- df$JOB_ID[row]
  if(id2 != id1) next # near EOF so skip it
  t2 <- df$TIMESTAMP[row]
  deltaR[i] <- t2 - t1
  i <- i + 1
  time1 <- TRUE
 }
}
Another benefit of this approach is that I didn't need to examine the log file to see which requests started but didn't complete, i.e., didn't form a pair.
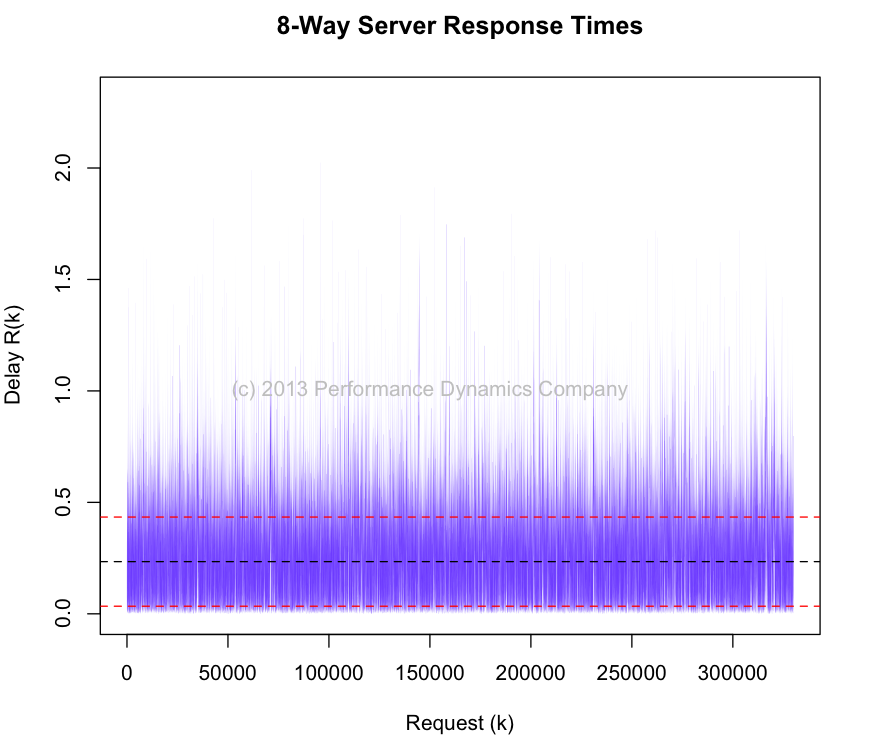
Since we have computed the difference of two-thirds of a million pairs, there are one-third of a million instantaneous RT samples shown in Figure 1. We can then determine the sample mean and standard deviation of these individual response times.
(Rmu <- mean(deltaR))
[1] 0.2341104
(Rsd <- sd(deltaR))
[1] 0.1999741
These values can now be substituted directly into equations $\eqref{eqn:mm8r80}$—$\eqref{eqn:mm8r95}$ to determine the multi-server percentiles.
(R80 <- Rmu + 2*Rsd/3)
[1] 0.3674265
(R90 <- Rmu + 4*Rsd/3)
[1] 0.5007425
(R95 <- Rmu + 6*Rsd/3)
[1] 0.6340586
We can check these values against the quantile function in R:
quantile(deltaR,c(0.80,0.90,0.95))
      80%       90%       95%
0.3707738 0.5002468 0.6268308
The following table summarizes and compares the response-time percentiles evaluated in three different ways to four significant digits of precision.
| Simulation | Analytic | ||
|---|---|---|---|
| Percentile | Empirical | Equations | Equations |
| R80 | 0.3708 | 0.3674 | 0.3666 |
| R90 | 0.5002 | 0.5007 | 0.4999 |
| R95 | 0.6268 | 0.6341 | 0.6332 |
- The Empirical column shows the results of calculating the percentiles manually or using a function like quantile() applied to the raw response-time data.
- The Equations column, in the Simulation section, shows the results of first calculating the mean and standard deviation for the raw data and then applying equations $\eqref{eqn:mm8r80}$—$\eqref{eqn:mm8r95}$.
- The Equations column, in the Analytic section, shows the results of first calculating the mean and standard deviation analytically for an M/M/8 queuing model and then applying equations $\eqref{eqn:mm8r80}$—$\eqref{eqn:mm8r95}$.
Although there is no closed-form analytic expression for multi-server response-time percentiles (as there is for a single-server), the Guerrilla approximations $\eqref{eqn:mm8r80}$—$\eqref{eqn:mm8r95}$ are just as utilitarian as $\eqref{eqn:mm1r80}$—$\eqref{eqn:mm1r95}$.
Percentiles in PDQ
Although I haven't implemented these percentiles in PDQ yet, it's now clear to me that the rather than trying to include them in the generic PDQ Report (which could really explode its size for a model with many PDQ nodes), it would better to have a separate function that can be called ad hoc. I'll be discussing these results in more detail in the 2014 Guerrilla classes. In the meantime ...Merry Xmas!
R-bloggers.com offers daily e-mail updates about R news and tutorials about learning R and many other topics. Click here if you're looking to post or find an R/data-science job.
Want to share your content on R-bloggers? click here if you have a blog, or here if you don't.