
"R": Plotting the spectra (Gasoline) – 002
[This article was first published on NIR-Quimiometría, and kindly contributed to R-bloggers]. (You can report issue about the content on this page here)
Want to share your content on R-bloggers? click here if you have a blog, or here if you don't.
“R” has a package called “ChemometricsWithR”, where we can get data from different analytical instruments including Near Infrared (NIR).Want to share your content on R-bloggers? click here if you have a blog, or here if you don't.
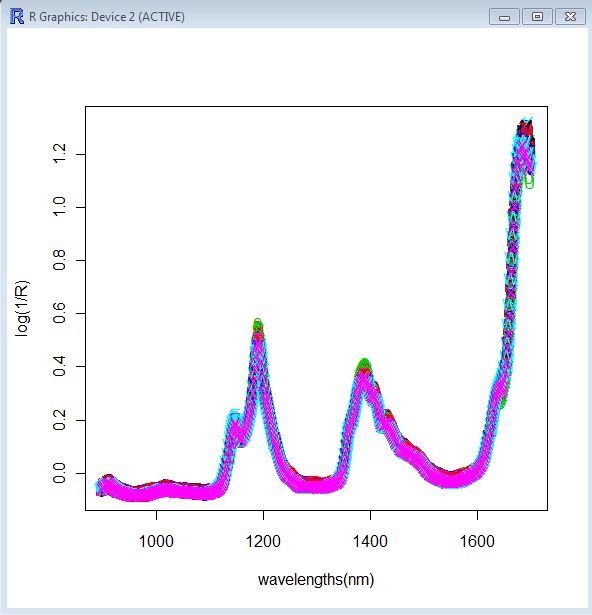
Follow the steps to plot the spectra of a gasoline data set:
In this other case we plot the spectra of the NIR shootout 2002:
> data(shootout)
> wavelengths<-seq(600, 1898,by=2)
> mattplot(wavelengths,shootout$calibrate.1[1,],xlab=”wavelength(nm)”,ylab=”log1/R)”)

> library(ChemometricsWithR)
> data(gasoline, package=”pls”)
> wavelengths<-seq(900, 1700,by=2)
> matplot(wavelengths,t(gasoline$NIR),lty=1,xlab=”wavelengths(nm)”,ylab=”log(1/R)”)
Tweet
To leave a comment for the author, please follow the link and comment on their blog: NIR-Quimiometría.
R-bloggers.com offers daily e-mail updates about R news and tutorials about learning R and many other topics. Click here if you're looking to post or find an R/data-science job.
Want to share your content on R-bloggers? click here if you have a blog, or here if you don't.