RObservations #41: Making a “Matlab Pumkin” in R
Want to share your content on R-bloggers? click here if you have a blog, or here if you don't.

Introduction
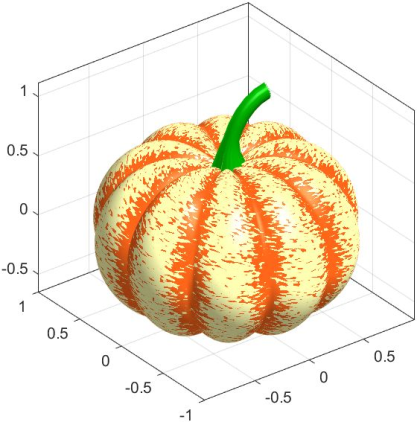
A while back I saw the Mathworks LinkedIn page make a post on how it is possible to make a Pumkin and other autumn gourds with Matlab code (for a more complete list of how to make other autumn Gourds in Matlab, check out Eric Ludlam’s Github repository).
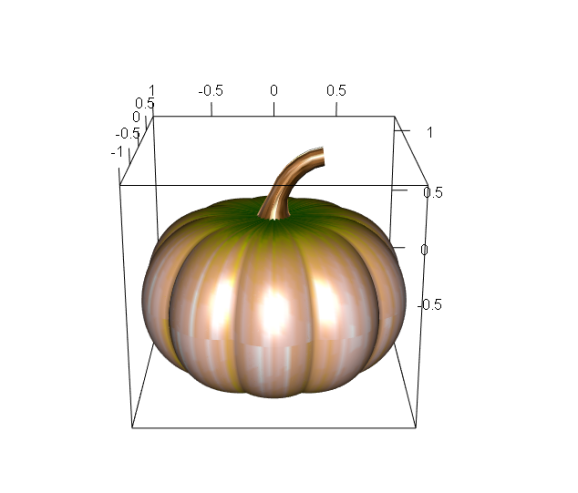
Seeing this inspired me to give it a shot in R and explore using 3D graphics with a playful example. In this short blog I share my attempt with how to make the a 3D pumpkin in R using the pracma and rgl libraries.
Matlab Code
The Matlab Code which was posted by Mathworks is:
% Pumpkin
[X,Y,Z]=sphere(200);
R=1-(1-mod(0:.1:20,2)).^2/12;
x=R.*X; y=R.*Y; z=Z.*R;
c=hypot(hypot(x,y),z)+randn(201)*.03;
surf(x,y,(.8+(0-(1:-.01:-1)'.^4)*.3).*z,c, 'FaceColor', 'interp', 'EdgeColor', 'none')
% Stem
s = [ 1.5 1 repelem(.7, 6) ] .* [ repmat([.1 .06],1,10) .1 ]';
[t, p] = meshgrid(0:pi/15:pi/2,0:pi/20:pi);
Xs = -(.4-cos(p).*s).*cos(t)+.4;
Zs = (.5-cos(p).*s).*sin(t) + .55;
Ys = -sin(p).*s;
surface(Xs,Ys,Zs,[],'FaceColor', '#008000','EdgeColor','none');
% Style
colormap([1 .4 .1; 1 1 .7])
axis equal
box on
material([.6 1 .3])
lighting g
camlight
This produces the following image:

The challenge for figuring out whats happening here lies in the Matlab syntax. I haven’t touched Matlab much since my first semester of undergrad. This and not not having access to a Matlab licence made it led me to figure things out from reading the Matlab docs and debugging in Octave – a Matlab compatible language.
Doing it in R
When I was first looked at the code, I thought it would be straight forward enough. However I was quick to learn that a 1-to-1 translation needed more effort than initially expected. For one, a function similar to the Matlab’s sphere function was not readily available in R or any of the libraries I looked into. I managed to figure that out by enlisting the help of Stack Overflow. However, even with the sphere function taken care of, I still wasn’t able to get it right. This time, I asked StackOverflow to basically do the work for me. But even with this, I only managed to get a partial answer for the shape of the pumpkin sans stem:
library(pracma)
library(rgl)

# 3D sphere function
sphere <- function(n) {
  dd <- expand.grid(theta = seq(0, 2*pi, length.out = n+1),
                    phi = seq(-pi, pi, length.out = n+1))
  with(dd,
       list(x = matrix(cos(phi) * cos(theta), n+1),
            y = matrix(cos(phi) * sin(theta), n+1),
            z = matrix(sin(phi), n+1))
  )
}

# Pumpkin Code
sph <- sphere(200)
X <- sph[[1]]
Y <- sph[[2]]
Z <- sph[[3]]

# scaling
R <- 1 - (1 - seq(from=0, to=20, by=0.1) %% 2) ^ 2 / 12 # function
R2 <- 0.8 - Z[1,]^4 * 0.2

x <- R * X # scale rows for wavy side
y <- R * Y # scale rows for wavy side
z <- t(R2 * t(Z)) # scale columns by transpose for flat oval shape

# color according to distance to [0,0,0]
hypot_3d <- function(x, y, z) {
  return(sqrt(x^2 + y^2 + z^2))
}
c_ <- hypot_3d(x,y,z) + rnorm(201) * 0.03
color_palette <- terrain.colors(20) # color look-up table
col <- color_palette[ as.numeric(cut(c_, breaks = 20)) ] # assign color to 20 levels of c_


persp3d(x, y, z, color = col, aspect=FALSE,xlab="", ylab="", zlab="")

For the stem, I had to go at it myself. After much debugging in Octave, I managed to figure out how to replicate the required matrix operations. What’s interesting is that in the original Matlab code, only half of the stem is plotted. To make a full stem, the stem needs to be plotted twice with the second plot of the stem having the negative of the Y matrix:
# Code for Stem

s <- c(1.5, 1, rep(0.7,6)) %*% t(c(rep(c(0.1,0.06),10),0.1))
mesh <- meshgrid(x=seq(from=0,to=pi/2,by=pi/15),y=seq(from=0,to=pi,by=pi/20))
tt<- mesh[[1]]
p <- mesh[[2]]
Xs<- -(0.4-cos(p)*t(s))*cos(tt)+0.4
Zs <- (0.5-cos(p)*t(s))*sin(tt) + 0.55
Ys <-  -sin(p)*t(s)
color_palette_2 <- hcl.colors(20,palette = "Purple-Brown")
col2 <- color_palette_2[ as.numeric(cut(c_, breaks = 20)) ] # assign color to 20 levels of c_

# Pumpkin
persp3d(x, y, z, color = col, aspect=FALSE,xlab="", ylab="", zlab="")

# Stem (Both sides)
surface3d(Xs,Ys,Zs,color=col2)
surface3d(Xs,-Ys,Zs,color=col2)

And there you have it! A “Matlab pumpkin” in R!
Conclusion
It was definitely interesting working on this! After finishing this blog, I learned that it is possible to use modern libraries (like plotly and rayshader) to get a nicer visual, so this blog is just one of the ways that you can make 3D graphics in R.
If you have another way of making a “Matlab Pumpkin” in R which looks better or more interesting please feel free to share your code in the comments!
Thank you for reading!

Want to see more of my content?
Be sure to subscribe and never miss an update!
R-bloggers.com offers daily e-mail updates about R news and tutorials about learning R and many other topics. Click here if you're looking to post or find an R/data-science job.
Want to share your content on R-bloggers? click here if you have a blog, or here if you don't.
