
Label placement with spplot and lattice
Want to share your content on R-bloggers? click here if you have a blog, or here if you don't.
The package maptools includes new functions to label points and labels.
Line labelling
The lineLabel function produces and draws text grobs following the paths defined by a list of Line objects. The sp.lineLabel methods use this function to work easily with spplot. Let’s use the meuse data to illustrate how to use it:
data(meuse.grid)
coordinates(meuse.grid) = ~x+y
proj4string(meuse.grid) <- CRS("+init=epsg:28992")
gridded(meuse.grid) = TRUE


data(meuse)
coordinates(meuse) = ~x+y
data(meuse.riv)
## Create a SpatialLines object with ID=1
meuse.sl <- SpatialLines(list(Lines(list(Line(meuse.riv)), "1")))

library(RColorBrewer)
myCols <- adjustcolor(colorRampPalette(brewer.pal(n=9, 'Reds'))(100), .85)

## label is a wrapper to build a character vector with names
## according to the SpatialLines ID's
labs <- label(meuse.sl, 'Meuse River')
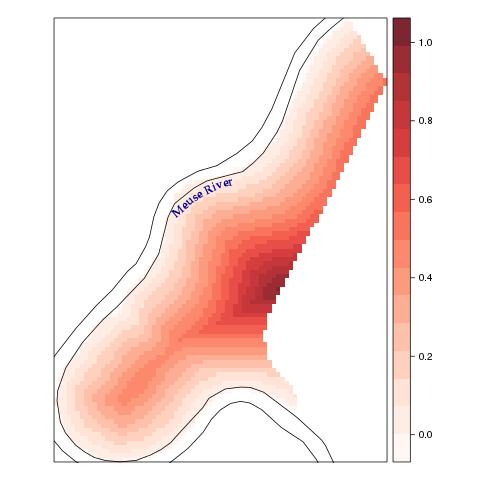
With textloc you can choose where the label must be located. For example, with maxDepth the label will start at the point where the line reaches its maximum depth:
sl1 <- list('sp.lineLabel', meuse.sl, label=labs,
            position='below', textloc='maxDepth',
            spar=.2,
            col='darkblue', cex=1,
            fontfamily='Palatino',
            fontface=2)

spplot(meuse.grid["dist"],
       col.regions=myCols,
       sp.layout = sl1)
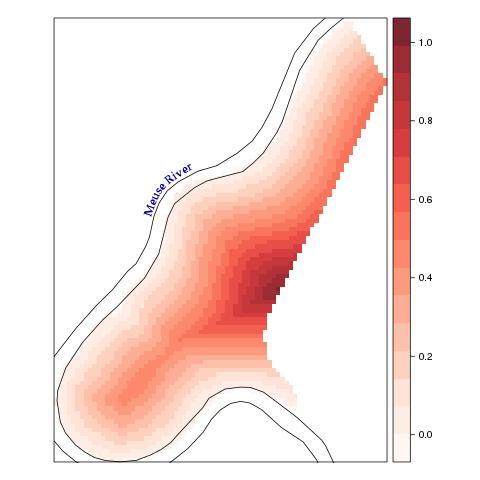
The default is to place the label in a stable region where the sign of the slope remains constant.
sl2 <- modifyList(sl1, list(textloc = 'constantSlope'))

spplot(meuse.grid["dist"],
       col.regions=myCols,
       sp.layout = sl2)
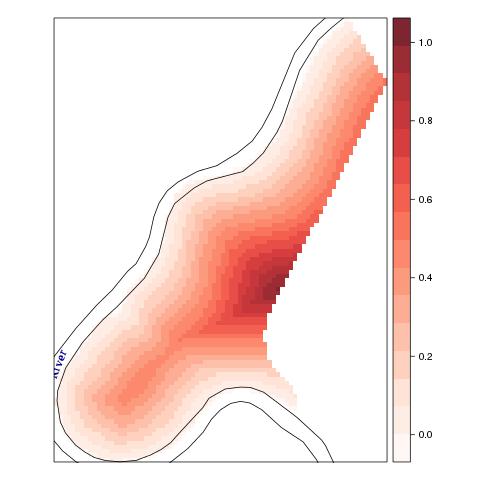
But you can define the label location with a numeric index relative to the line length:
sl3 <- modifyList(sl1, list(textloc = 140, position='above'))

spplot(meuse.grid["dist"],
       col.regions=myCols,
       sp.layout = sl3)
There is a more sophisticated example in the Spatial Data chapter of my forthcoming book.
Point labelling
This package already provided the pointLabel function with optimization routines to find good locations for point labels without overlaps. This function, useful for base graphics, has been adapted to work with lattice graphics and with the spplot functions.
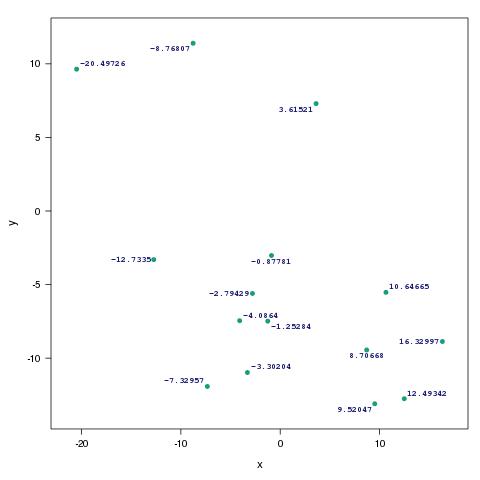
You will find the panel.pointLabel to use with xyplot and the rest of the lattice family:
library(maptools)
library(lattice)

n <- 15
x <- rnorm(n)*10
y <- rnorm(n)*10
labels <- as.character(round(x, 5))


myTheme <- list(add.text=list(
                  cex=0.7,
                  col='midnightblue',
                  fontface=2,
                  fontfamily='mono'))

xyplot(y~x,
       labels=labels,
       par.settings=myTheme,
       panel=function(x, y, labels, ...){
         panel.xyplot(x, y, ...)
         panel.pointLabel(x, y, labels=labels, ...)
       })
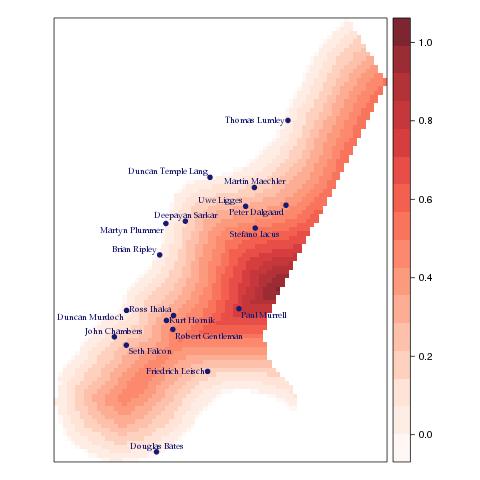
And there is the sp.pointLabel method to be combined with spplot:
data(meuse.grid)
coordinates(meuse.grid) = ~x+y
proj4string(meuse.grid) <- CRS("+init=epsg:28992")
gridded(meuse.grid) = TRUE

library(RColorBrewer)
myCols <- adjustcolor(colorRampPalette(brewer.pal(n=9, 'Reds'))(100), .85)

pts <- spsample(meuse.grid, n=15, type="random")

## Let's print the name of some R authors
Rauthors <- readLines(file.path(R.home("doc"), "AUTHORS"))[9:28]
someAuthors <- Rauthors[seq_along(pts)]

sl1 <- list('sp.points', pts, pch=19, cex=.8, col='midnightblue')
sl2 <- list('sp.pointLabel', pts, label=someAuthors,
            cex=0.7, col='midnightblue',
            fontfamily='Palatino')

spplot(meuse.grid["dist"], col.regions=myCols, sp.layout=list(sl1, sl2))
There is a more sophisticated example in the Spatial Data chapter of my forthcoming book.
R-bloggers.com offers daily e-mail updates about R news and tutorials about learning R and many other topics. Click here if you're looking to post or find an R/data-science job.
Want to share your content on R-bloggers? click here if you have a blog, or here if you don't.