getSymbols Extra
Want to share your content on R-bloggers? click here if you have a blog, or here if you don't.
The getSymbols function from the quantmod package is an easy and convenient way to bring historical stock prices into your R environment. You need to specify the list of tickers, the source of historical prices and dates. For example following commands will download historical stock prices from yahoo finance for ‘RWX’, ‘VNQ’, ‘VGSIX’ symbols:
	data <- new.env()
	getSymbols.extra(c('RWX','VNQ','VGSIX'), src = 'yahoo', from = '1980-01-01', env = data, auto.assign = T)
Now, the data environment contains the historical stock prices. For example, create plot for RWX using the code below:
plot(data$RWX)
Sometimes, I find that getSymbols functionality can be extended. For example, it would be nice to rename the series. I.e. RWX is a real estate ETF, so we could ask getSymbols function to get RWX, but call output Real.Estate. Another useful feature would be ability to specify how to extend the data. I.e. RWX is only started trading in 2007, it would be convenient to extend RWX time series with VNQ and VGSIX.
I created the getSymbols.extra function to address these features. The getSymbols.extra function allows you to specify tickers in the following format:
- RWX : the original functionality. i.e get historical stock prices for RWX and it can be accessed with data$RWX
- Real.Estate = RWX : get historical stock prices for RWX, rename it to Real.Estate, and it can be accessed with data$Real.Estate
- RWX + VNQ + VGSIX : get historical stock prices for RWX, VNQ, VGSIX and extend RWX with VNQ, next extend it with VGSIX, and it can be accessed with data$RWX
- Real.Estate = RWX + VNQ + VGSIX : mix and match above functionality
Let’s look at the example:
###############################################################################
# Load Systematic Investor Toolbox (SIT)
# http://systematicinvestor.wordpress.com/systematic-investor-toolbox/
###############################################################################
setInternet2(TRUE)
con = gzcon(url('http://www.systematicportfolio.com/sit.gz', 'rb'))
    source(con)
close(con)

	tickers = spl('REIT=RWX, RWX+VNQ, REIT.LONG=RWX+VNQ+VGSIX')
	data <- new.env()
		getSymbols.extra(tickers, src = 'yahoo', from = '1980-01-01', env = data, auto.assign = T)
	bt.start.dates(data)

	data$symbolnames = spl('REIT.LONG,RWX,REIT')
		for(i in data$symbolnames) data[[i]] = adjustOHLC(data[[i]], use.Adjusted=T)
	bt.prep(data, align='keep.all')

	plota.matplot(data$prices)

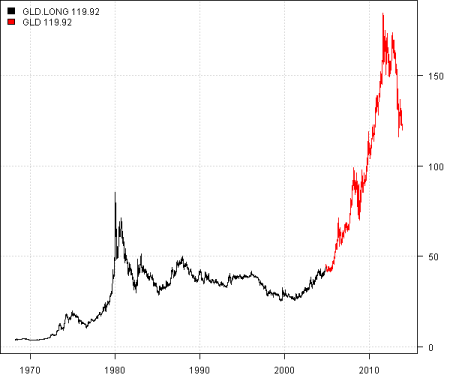
The REIT.LONG is RWX extended using VNQ and next using VGSIX.
There is also a possibility to provide custom data into the getSymbols.extra function. I.e. the data which is not available through the getSymbols function.
For example, to extend GLD time series we might used historical Gold prices from Bundes Bank:
	# Use extrenal data
	raw.data <- new.env()
		raw.data$GOLD = bundes.bank.data.gold()

	tickers = spl('GLD, GLD.LONG=GLD+GOLD')
	data <- new.env()
		getSymbols.extra(tickers, src = 'yahoo', from = '1980-01-01', env = data, raw.data = raw.data, auto.assign = T)
	bt.start.dates(data)
	data$symbolnames = spl('GLD.LONG,GLD')
   		for(i in data$symbolnames) data[[i]] = adjustOHLC(data[[i]], use.Adjusted=T)
	bt.prep(data, align='keep.all')

	plota.matplot(data$prices)
The main goal of the getSymbols.extra function is to simplify your data acquisition/preparation step. Please let me know if you run into any problems or have suggestions.
To view the complete source code for this example, please have a look at the getSymbols.extra.test() function in utils.r at github.
R-bloggers.com offers daily e-mail updates about R news and tutorials about learning R and many other topics. Click here if you're looking to post or find an R/data-science job.
Want to share your content on R-bloggers? click here if you have a blog, or here if you don't.

