
FAO statistical areas in Google Earth
[This article was first published on fishvice, and kindly contributed to R-bloggers]. (You can report issue about the content on this page here)
Want to share your content on R-bloggers? click here if you have a blog, or here if you don't.
Some time ago I did a blog describing how to get ICES and NAFO statistical areas, originally as shapefiles into Google Earth readable format (ICES, NAFO). These areas are the primary fisheries areas upon which nominal fisheries catch statistics have been reported in the past (since 1905 when it comes to ICES).Want to share your content on R-bloggers? click here if you have a blog, or here if you don't.
A colleague of mine asked me if I was aware of an analogous format for the global FAO fisheries statistical areas. After some search I found indeed that FAO provides these statistical areas in a Google Earth readable format. But a little cumbersome for my taste. Luckily, the shapefiles are easily available at the FAO site. So here is my take on things:
################################################################################
# FAO statistical areas in Google Earth format
require(rgdal)
require(plotKML)
setwd("~/Dropbox/blogspotScripts/20120701FAOareas/") # your 'native' directory
url <- 'http://www.fao.org/geonetwork/srv/en/resources.get?id=31627&fname=fa_.zip&access=private'
download.file(url,destfile="~/Downloads/tmp.zip") # your 'native' directory
unzip("~/Downloads/tmp.zip") # your 'native' directory
fao <- readOGR(".","fa_")
setwd("~/Dropbox/Public/") # your 'native' directory
plot(fao) # a peek preview in R
# here one could simply do, via function from the plotKML package
kml(fao,file="tmpFAO.kml") # open your tmp.kml in GE to have a view
# but that stuff is no good
# to put some order to things, etc.
names(fao) <- tolower(names(fao))
dat <- as.data.frame(fao)
i <- data.frame(str_locate(fao$f_subarea,"_"))
i <- !is.na(i[,1])
fao$f_subarea[i] <- str_sub(fao$f_subarea[i],2)
fao$f_division[i] <- str_sub(fao$f_division[i],2)
fao$f_subdivis[i] <- str_sub(fao$f_subdivis[i],2)
fao$name <- ifelse(!is.na(fao$f_subunit),fao$f_subunit,
ifelse(!is.na(fao$f_subdivis),fao$f_subdivis,
ifelse(!is.na(fao$f_division),fao$f_division,
ifelse(!is.na(fao$f_subarea),fao$f_subarea,
fao$f_area))))
fao <- as(fao,"SpatialLinesDataFrame")
fao$id <- as.numeric(fao$f_area)
area <- sort(unique(fao$f_area)) # put the stuff in order of the major areas
# again some function of the plotKML packages put in use
kml_open("fao.kml")
# filling up the russian doll
for (i in 1:length(area)) {
tmp <- fao[fao$f_area %in% area[i],]
kml_layer.SpatialLines(tmp,labels=tmp$name,folder.name = area[i])
}
kml_close("fao.kml")
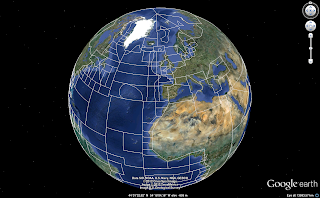
kml_compress("fao.kml") # create a compressed (KMZ) fileDid not quite get want I really wanted (plotKML is really in its infancy, just released to cran last week. But a very promising package). So played a little around (non reproducible code) to end up, preliminary with this, the following being a snapshot:
To leave a comment for the author, please follow the link and comment on their blog: fishvice.
R-bloggers.com offers daily e-mail updates about R news and tutorials about learning R and many other topics. Click here if you're looking to post or find an R/data-science job.
Want to share your content on R-bloggers? click here if you have a blog, or here if you don't.