
Complex Tables – Exercises
Want to share your content on R-bloggers? click here if you have a blog, or here if you don't.
 The
The ftable() function combines Cross-Tabulation with the ability to format , or “flatten”, contingency tables of 3 or more dimensions.
The resulting tables contain the combined counts of the categorical variables, (also factor variables in R), that are then arranged as a matrix, whose rows and columns correspond to the original data’s rows and columns. The ftable() parameters, row.vars and col.vars, control the format of the table.
Displaying a contingency table in this flat matrix form is often preferable to showing it as a higher-dimensional array. The write.ftable, and read.ftable, functions allow for the saving, and accessing of Contigency Tables of 3 or more dimensions.
Answers to the exercises are available here.
Exercise 1
In order to demonstrate the ftable() function’s capabilities, input the Titanic data from R:
data(Titanic)
For the first exercise, create a basic flat contingency table from the Titanic data, using the ftable() function.
Exercise 2
The row.vars argument specifies the table variables that will format as table rows. row.vars= is definable with variable numbers, or the variable names.
Therefore, use row.vars= to specify the variable, Class, as the row variables.
Exercise 3
Combine the row.vars and col.vars arguments to specify Class & Sex as the row variables, and Survived as the column variable.
row.vars and col.vars are definable with variable numbers, or the variable names.
Exercise 4
With the parameters from the ftable used in Exercise 3, reverse the order of the Class and Sex columns.
Exercise 5
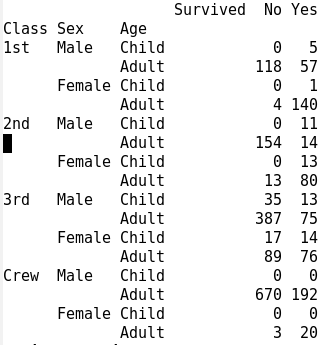
Next, using the ftable() code from Exercise 4, specify Age as the column variable.
As you can see from this exercise, ftable() allows for the formatting of data for different areas of inquiry.
Exercise 6
Using the data.frame() function will coerce ftable columns into rows. To demonstrate this, place the ftable() from Exercise 5, within the data.frame() function.
Exercise 7
Function ftable.formula provides a formula interface, (a data = . argument), for creating flat contingency tables.
For example:
ftable(Survived ~ ., data = Titanic)
Use the formula interface for ftable() to display the quantities in the Titanic data for Male/Female passengers, by Class and Age.
Exercise 8
The ftable() function creates an object of class ftable. In order to demonstrate this, save the results of the ftable formula from Exercise 5 as an ftable variable called titanicStats.
Exercise 9
Using the write.table() function, write the ftable, titanicStats, to a file. Make sure your working directory is set to a folder where you can find the resulting file. Name the file, “table1”.
Exercise 10
read.ftable() reads in a flat-like contingency table from a file.
Using read.ftable(), read the file, “table1”, into an R language environment variable called data1.
R-bloggers.com offers daily e-mail updates about R news and tutorials about learning R and many other topics. Click here if you're looking to post or find an R/data-science job.
Want to share your content on R-bloggers? click here if you have a blog, or here if you don't.