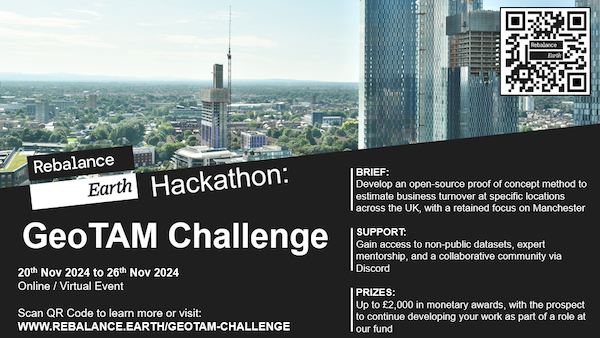
Blog Archives

John Snow’s Cholera data in more formats

March 13, 2013
By
John Snow’s Cholera data in more formats

In honour of the bicentenary of John Snow’s birth – and because I was asked to by someone via email – I have now released my digitisation of John Snow’s Cholera data in a few other formats: KML and as Google Fusion Tables. To save you reading my previous blog posts on the subject, I’ll

Read more »

In praise of ProjectTemplate for reproducible research

September 7, 2012
By
In praise of ProjectTemplate for reproducible research

As you might know from some of my previous posts, I’m a big fan of making my scientific work reproducible. My main reasons for being so keen on this are: 1. Reproducibility is key to science – if it can’t be reproduced then it can not be verified (that is, the experiment can’t be tried again

Read more »

John Snow’s famous cholera analysis data in modern GIS formats

January 6, 2012
By
John Snow’s famous cholera analysis data in modern GIS formats

In 1854 there was a massive cholera outbreak in Soho, London – in three days over 120 people died from the disease. Famously, John Snow plotted the locations of the deaths on a map and found they clustered around a pump in Broad Street – he suggested that the pump be taken out of service

Read more »

Please use sensible colours in your maps

November 2, 2011
By

If you are creating maps then for goodness sake Use sensible colours!  I was helping some undergraduates with some work the other day, and they decided to use the following colour scheme for representing river depth: Deep water: Red Medium-depth water: Bright green Shallow water: Pink Why did they do this? Well, either they were

Read more »

My programming journey

May 20, 2011
By
My programming journey

When clearing out some of my old programming books the other day I realised how far I’d come with programming over the years, and the number of different technologies that I have used over time. I thought I’d do a little summary post going from first programming experience to now – and it’s amazing what’s

Read more »

Review: R Graphs Cookbook by Hrishi Mittal

March 11, 2011
By
Review: R Graphs Cookbook by Hrishi Mittal

Summary: Very useful for reference while producing graphs, and very comprehensive (including heat-maps, 3D graphs and maps). Reference: Mittal, H. V., 2011, R Graph Cookbook, Packt Publishing, Birmingham, UK, 272 pages,  Publisher’s Website As a scientist I often need to plot graphs of my data, so I am keen to learn more about how to

Read more »

Review: R in a Nutshell by Joseph Adler

January 17, 2011
By
Review: R in a Nutshell by Joseph Adler

Summary: Very comprehensive and very useful, but not good for a beginner. Great book though – definitely has a place on my bookshelf. Reference: Adler, J., 2010, R in a Nutshell, O’Reilly, Sebastopol, CA, 611 pages  O’Reilly Link After reviewing a book about R designed for beginners (see my previous post) I thought I’d step

Read more »

Review: Statistical Analysis with R: Beginner’s Guide by John M. Quick

January 1, 2011
By
Review: Statistical Analysis with R: Beginner’s Guide by John M. Quick

Summary: If you can get past the strange underlying story, then this gives a good introduction to R to someone with no programming experience. However, if you have any experience with other programming languages then another book is likely to be more suitable. Reference: Quick, J. M., Statistical Analysis in R: Beginners Guide, Packt Publishing,

Read more »

Producing grids of plots in R with ggplot2: A journey of discovery

August 26, 2010
By
Producing grids of plots in R with ggplot2: A journey of discovery

I’ve just gone through a bit of a ‘journey of discovery’ in R while trying to plot a grid of plots for one of the research projects I’m doing. I wanted to write a simple function which could produce this grid of plots from a CSV file, allowing me to easily view the trends of

Read more »