
Author inflation in academic literature
Want to share your content on R-bloggers? click here if you have a blog, or here if you don't.
There seems to be a general consensus that author lists in academic articles are growing. Wikipedia says so, and I’ve also come across a published letter and short Nature article which accept this is the case and discuss ways of mitigating the issue. Recently there was an interesting discussion on academia.stackexchange on the subject but again without much quantification. Luckily given the array of literature database APIs and language bindings available, it should be pretty easy to investigate with some statistical analysis in R.
rplos
ROpenSci offers nice R language bindings for the PLOS (I’m more used to PLoS but I’ll go with it) API, called rplos. There’s no particular reason to limit the search to PLOS journals but rplos seems significantly more straightforward to work with than pubmed API packages I’ve used in the past like RISmed.
Additionally the PLOS group contains two journals of particular interest to me:
- PLOS Computational Biology — a respectable specialist journal in my field; have bioinformatics articles been particularly susceptible to author inflation?
- PLOS ONE — the original mega-journal. I wonder if the huge number of articles published here show different trends in authorship over time.
The only strange part of the search was at the PLOS API end. To search by the publication_year field you need to supply both a beginning and end date range, in the form:
publication_date:[2001-01-01T00:00:00Z TO 2013-12-31T23:59:59Z]
A tad verbose, right? I can’t imagine wanting to search for things published at a particular time of day. A full PLOS API query using the rplos package looks something like this:
searchplos(
  # Query: publication date in 2012
  q  = 'publication_date:[2012-01-01T00:00:00Z TO 2012-12-31T23:59:59Z]',

  # Fields to return: id (doi) and author list
  fl = "id,author",

  # Filter: only actual articles in journal PLOS ONE
  fq = list("doc_type:full",
            "cross_published_journal_key:PLoSONE"),

  # 500 results (max 1000 per query)
  start=0, limit=500, sleep=6)
A downside of using the PLOS API is that the set of journals are quite recent, PLOS ONE started in 2006 and PLOS Biology was only a few years before in 2003, so it’ll only give us a limited window into any long-term trends.
Distribution of author counts
Before looking at inflation we can compare the distribution of author counts per paper between the journals:

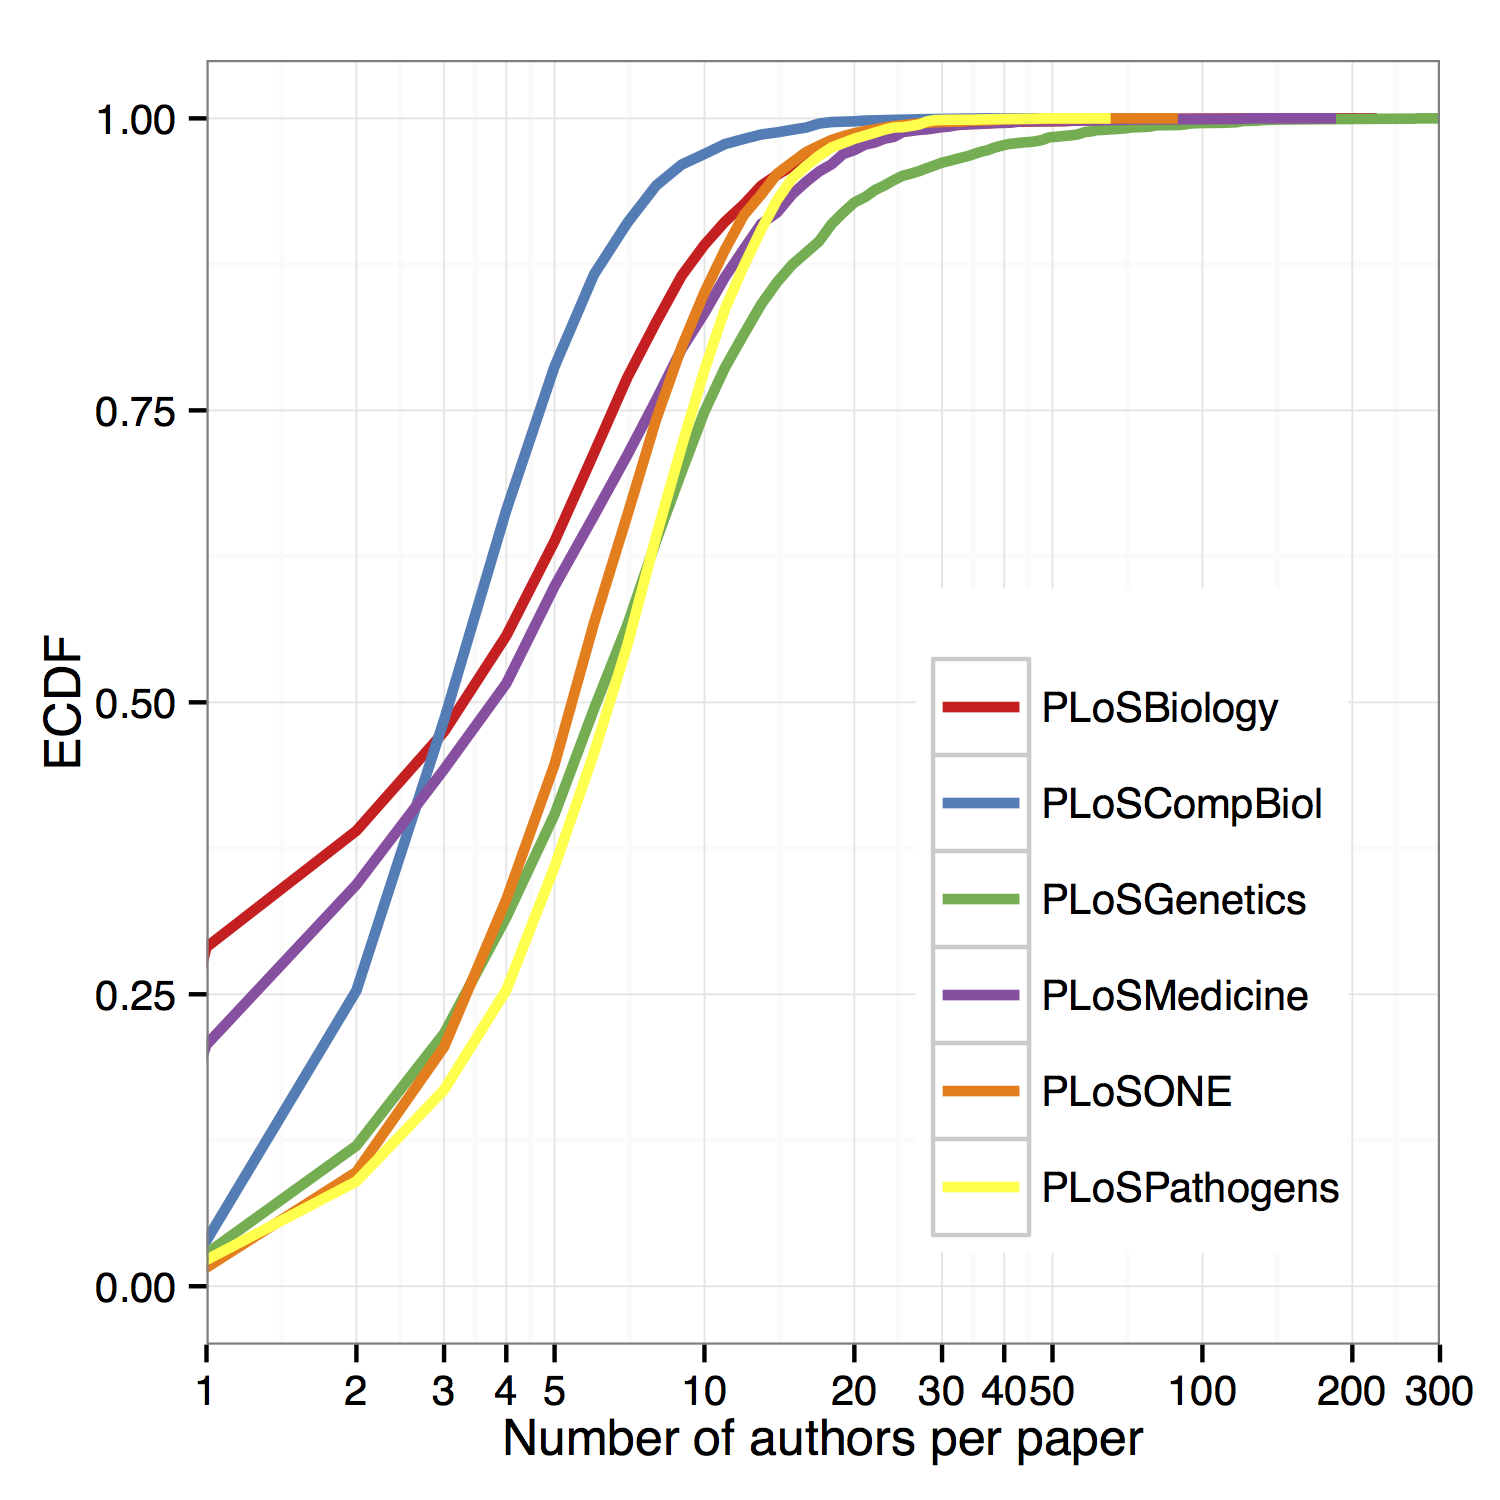
Possibly more usefully — but less pretty — the same data be plotted as empirical cumulative distribution functions (ECDF). From these we can see that PLOS Biology had the highest proportion of single-author papers in my sample (n = ~22,500 articles overall) followed by PLOS Medicine, with PLOS Genetics showing more high-author papers at the long-tail of the distribution, including the paper with the most authors in the sample (Couch et al., 2013 with 270 authors).
Author inflation
So, in these 6 different journals published by PLOS, how has the mean number of authors per paper varied across the past 7 years?

Above I’ve shown yearly means plus their 95% confidence intervals, as estimated by a non-parametric bootstrap method implemented in ggplot2. Generally from this graph it does look like there’s a slight upward trend on average, though arguably the mean is not the best summary statistic to use for this data, which I’ve shown is not normally distributed, and may better fit an extreme value distribution.
The relationship between publication date and number of authors per paper become clearer if it’s broken down by journal:

Here linear regression reveals a significant positive coefficient for year against mean author count per paper, as high as .52 extra authors per year on average, down to just .06 a year for PLOS ONE. Surprisingly the mega-journal which published around 80,000 papers over this time period seems least susceptible to author inflation.
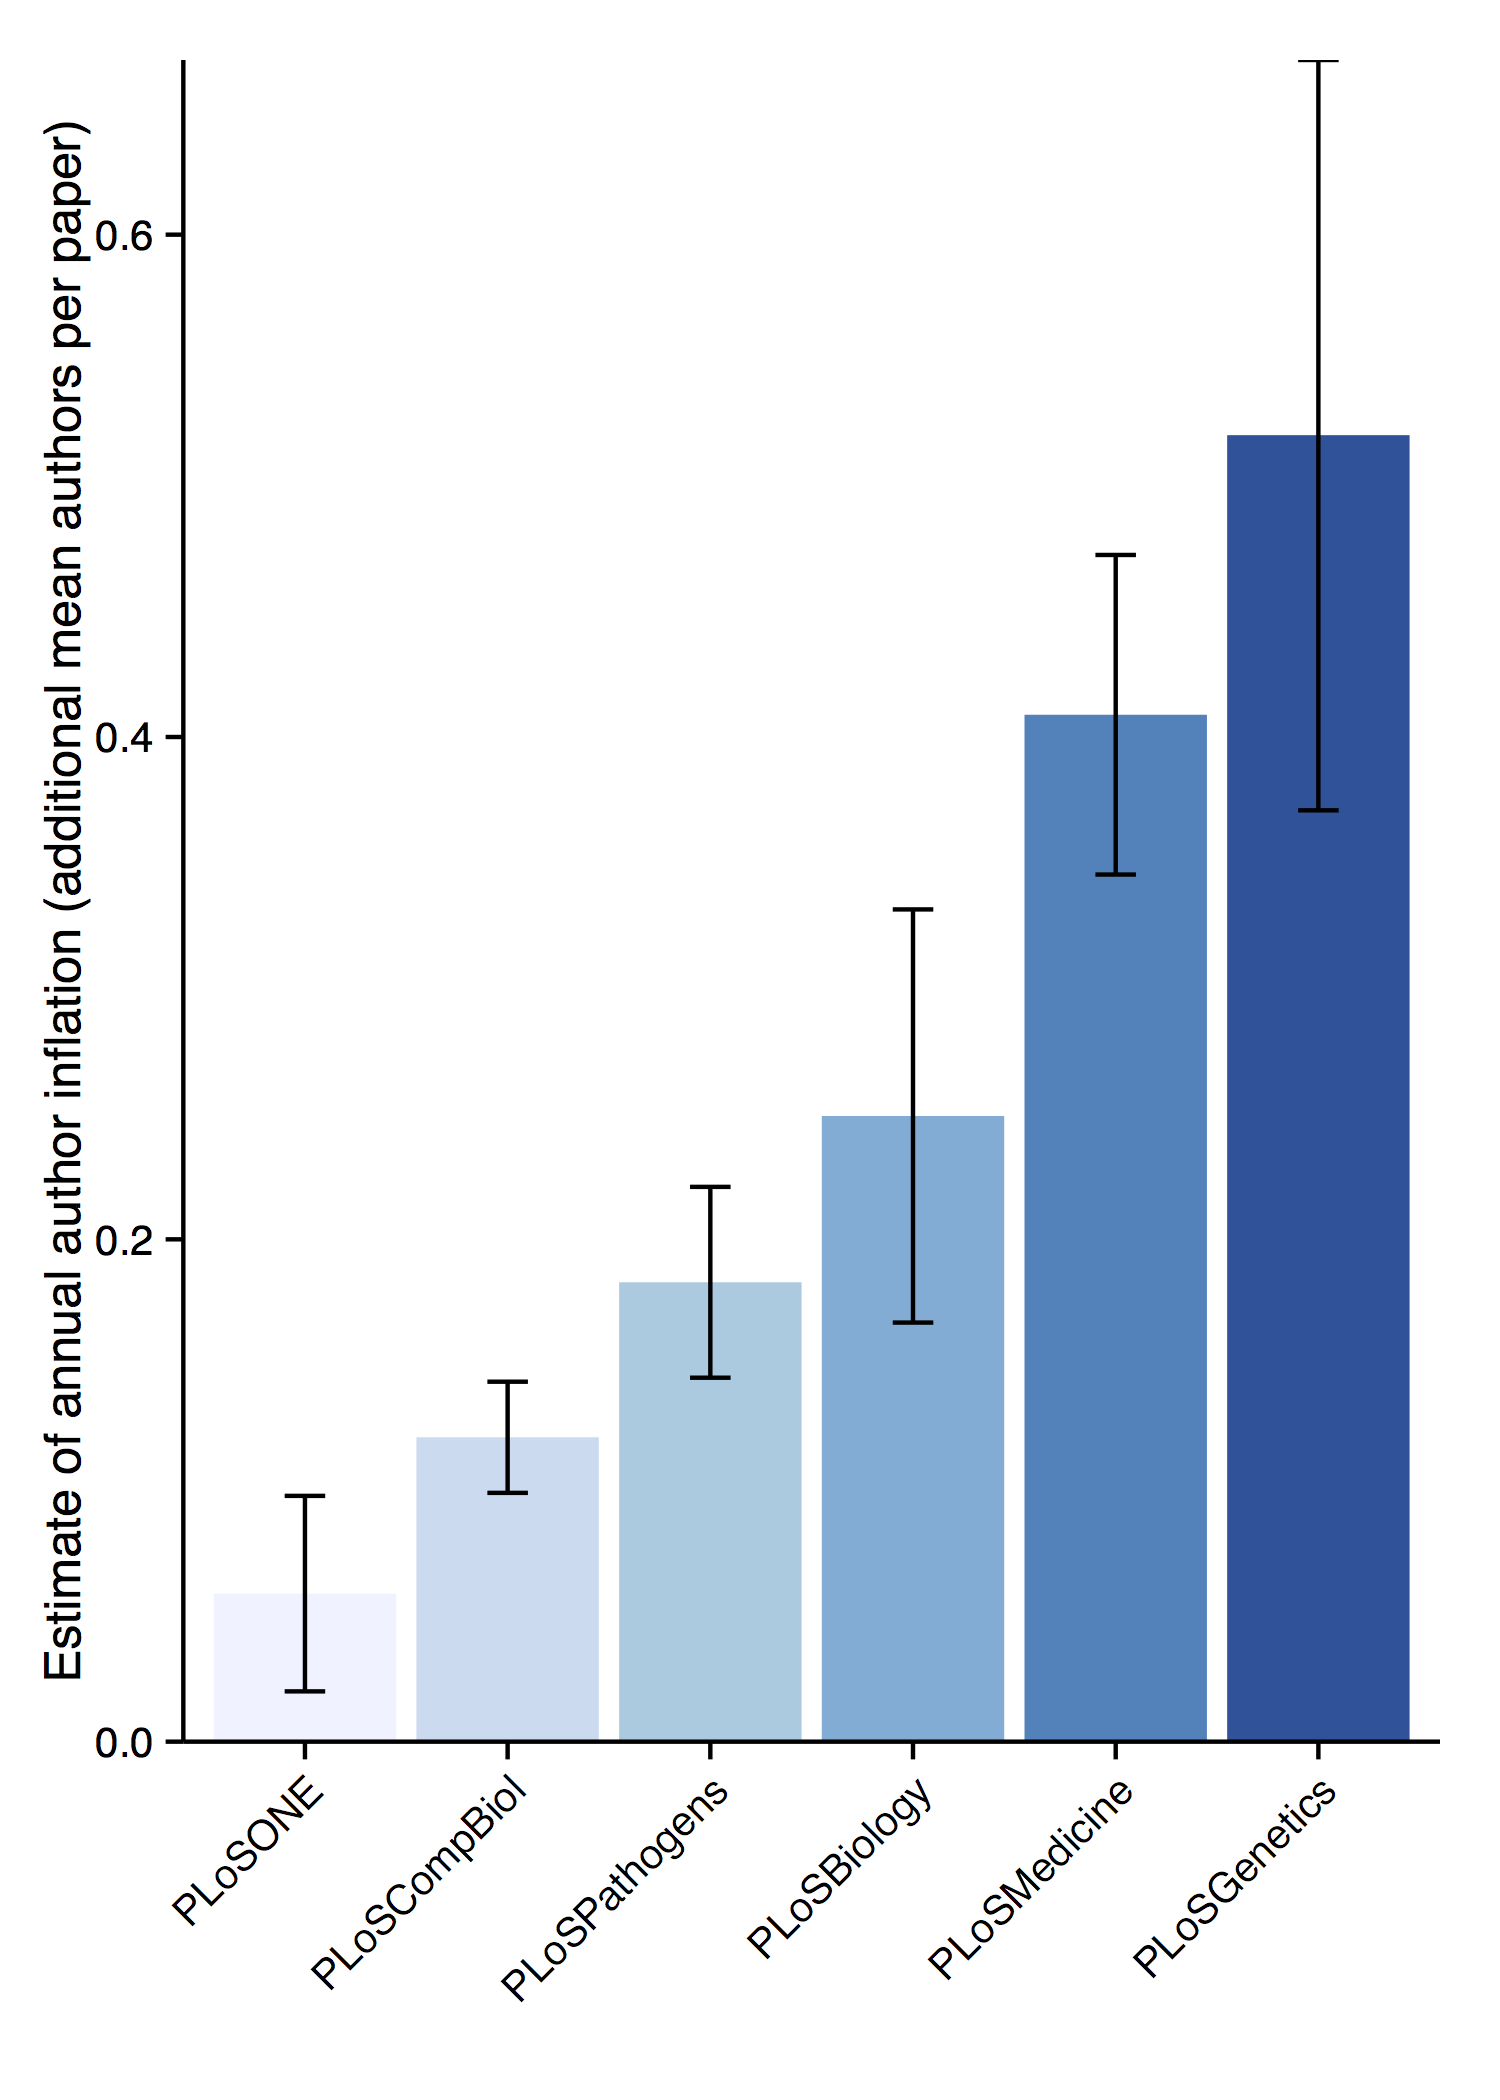 The explained variance in mean number of authors per paper (per year) ranges from .28 (PLOS ONE) up to an impressive .87 for PLOS Medicine, with PLOS Computational Biology not far behind on .83. However, PLOS Computational Biology had the second lowest regression coefficient, and the lowest average number of authors of the six journals — maybe us introverted computer types should be collaborating more widely!
Journal effects
It’s interesting to speculate on what drives the observed differences in author inflation between journals. A possible covariate is the roundly-condemned “Impact Factor” journal-level metric — are “high impact” journals seeing more author creep than lesser publications?

If estimate of author inflation is plotted against respective journals’ recent impact factors, there does indeed appear to be a positive correlation. However, this comparison only has 6 data points so there’s not enough evidence to reject the null hypothesis that there is no relationship between these two variables (p = 0.18).
Conclusion
Is author inflation occurring?
Yes, it certainly appears to be on average.
Is it a problem?
I don’t know, but I’d lean towards probably not.
The average trends could be reflecting the proliferation of “Big Science” with huge collaborative consortiums like ENCODE and FANTOM (though the main papers of those examples were targeted to Nature) and doesn’t necessarily support a conclusion that Publish or Perish culture is forcing lots of token authorships and backhanders between scientists.
Maybe instead (as the original discussion hypothesised), people that traditionally may not have been credited with authorship (bioinformaticians doing end-point analysis and lab technicians) are now getting recognised for their input more often, or conceivably advances in cloud computing, distributed data storage and video conferencing has better enabled larger collaborations between scientists across the globe!
Either way, evidence for author inflation is not evidence of a problem per se 🙂
Caveats
- Means used for regression — while we get a surprisingly high R2 for regression the mean number of authors per paper per year, the predictive power for individual papers unsurprisingly vanishes (R2 plummets to between .02 and 4.6 × 10⁻⁴ per journal — significant non-zero coefficients remain). Author inflation wouldn’t be expected to exhibit consistent and pervasive effects in all papers, for example reviews, letters and opinion pieces presumably have consistently lower author counts than research articles and not all science can work in a collaborative, multi-author framework.
- Search limits — rplos returns a maximum of 1000 results at a time (but they can be returned sequentially using the
startandlimitparameters). They seem to be drawn in reverse order of time so the results here probably aren’t fully representative of the year in some cases. This has also meant my sample is unevenly split between journals: PLoSBiology: 2487; PLoSCompBiol: 3403; PLoSGenetics: 4013; PLoSMedicine: 2094; PLoSONE: 7176; PLoSPathogens:3647; Total: 22,460. - Resolution — this could be done in a more fine-grained way, say with monthly bins. As mentioned above, for high-volume journals like PLOS ONE, the sample is likely coming from the end of the years from ~2010 onwards.
Full code to reproduce analysis

R-bloggers.com offers daily e-mail updates about R news and tutorials about learning R and many other topics. Click here if you're looking to post or find an R/data-science job.
Want to share your content on R-bloggers? click here if you have a blog, or here if you don't.