
An Intuitive Approach to ROC Curves (with SAS & R)
[This article was first published on Econometric Sense, and kindly contributed to R-bloggers]. (You can report issue about the content on this page here)
Want to share your content on R-bloggers? click here if you have a blog, or here if you don't.
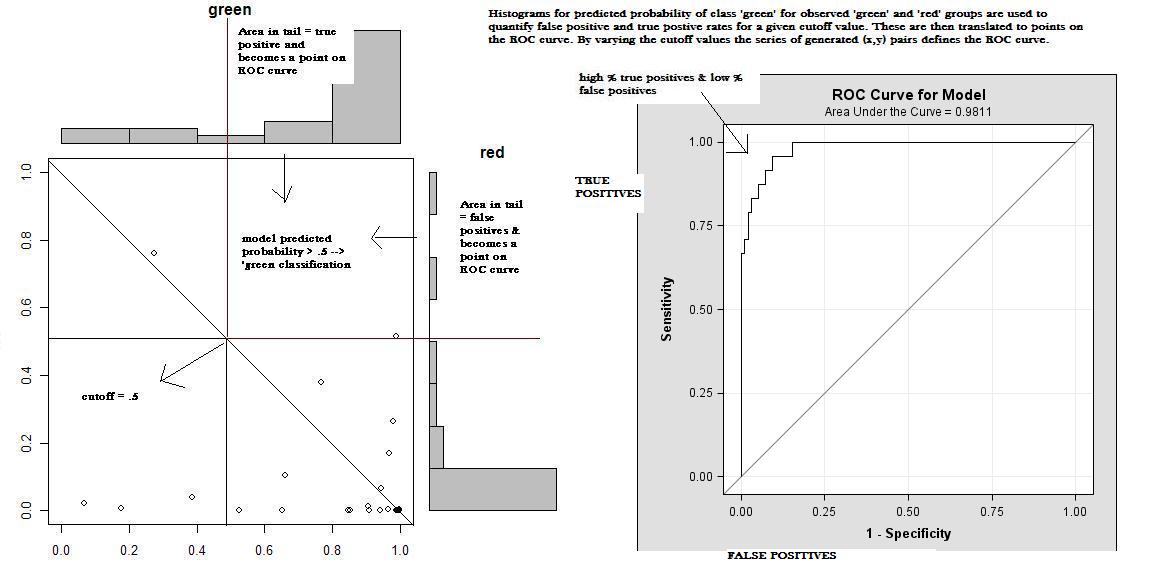
I developed the following schematic (with annotations) based on supporting documents (link) from the article cited below. The authors used R for their work. The ROC curve in my schematic was output from PROC LOGISTIC in SAS, the scatterplot with marginal histograms was created in R (code below) using the scored data from PROC LOGISTIC exported using my SAS MACRO %EXPORT_TO_R (link to SAS macro code)Want to share your content on R-bloggers? click here if you have a blog, or here if you don't.
(click to enlarge)
Reference:
Selection of Target Sites for Mobile DNA Integration in the Human Genome
Berry C, Hannenhalli S, Leipzig J, Bushman FD, 2006 Selection of Target Sites for Mobile DNA Integration in the Human Genome. PLoS Comput Biol 2(11): e157. doi:10.1371/journal.pcbi.0020157
quote “The data were analyzed using the R language and environment for statistical computing and graphics “
R code for plot was adapted from code provided via the addicted to R graph gallery : http://addictedtor.free.fr/graphiques/RGraphGallery.php?graph=78
# *------------------------------------------------------------------
# |
# | import scored logit data from SAS - code generated by SAS MACRO %EXPORT_TO_R
# |
# |
# *-----------------------------------------------------------------


#  set R working directory
setwd("C:\\Documents and Settings\\wkuuser\\Desktop\\PROJECTS\\Stats Training")

#  get data
dat.from.SAS <- read.csv("fromSAS_delete.CSV", header=T)

#  check data dimensions
dim(dat.from.SAS)
names(dat.from.SAS)


# *------------------------------------------------------------------
# |
# |  scatter plot with marginal histograms
# |
# |
# *-----------------------------------------------------------------

#
# model predicts P(G) so we want these probabilities for each group
#


# get p(G) data set for the group that is actually green

green <- dat.from.SAS[ dat.from.SAS$class=="G",]
dim(green)

# get p(G) data set for group that is actually red

red <- dat.from.SAS[ dat.from.SAS$class=="R",]
dim(red)

# just look at regular histograms for each group


hist(green$P_G, main = 'histogram for green')
hist(red$P_G, main = 'histogram for red')

# in order to do scatter plots n must be the same for each
# group, randomly sample n = n(green) from red


# Total number of red observations to match green
N <- 24
print(N)


# Randomly arrange the data and select out N size sample for red
# and test set.

dat <- red[sample(1:N),]
red.rs <- dat[1:N,]
dim(red.rs)

# does the distribution retain original properties? Yes
hist(red.rs$P_G, main = 'histogram for red sample')


plot(green$P_G, red.rs$P_G)


# *------------------------------------------------------------------
# |
# |  create the marginal plots
# |
# |
# *-----------------------------------------------------------------


def.par <- par(no.readonly = TRUE) # save default, for resetting...


# define histograms
Ghist <- hist(green$P_G,plot=FALSE)
Rhist <- hist(red.rs$P_G, plot=FALSE)

top <- max(c(Ghist$counts, Rhist$counts))
Grange <- c(0,1)
Rrange <- c(0,1)
nf <- layout(matrix(c(2,0,1,3),2,2,byrow=TRUE), c(3,1), c(1,3), TRUE)

#layout.show(nf)


par(mar=c(3,3,1,1))
plot(green$P_G, red.rs$P_G, xlim=Grange, ylim=Rrange, xlab="green", ylab="red")

par(mar=c(0,3,1,1))
barplot(Ghist$counts, axes=FALSE, ylim=c(0, top), space=0, main = 'green')

par(mar=c(3,0,1,1))
barplot(Rhist$counts, axes=FALSE, xlim=c(0, top), space=0, horiz=TRUE, main = 'red')

par(def.par)To leave a comment for the author, please follow the link and comment on their blog: Econometric Sense.
R-bloggers.com offers daily e-mail updates about R news and tutorials about learning R and many other topics. Click here if you're looking to post or find an R/data-science job.
Want to share your content on R-bloggers? click here if you have a blog, or here if you don't.