
Whole lotta shakin’ going on… Part 1
Want to share your content on R-bloggers? click here if you have a blog, or here if you don't.
Late last year there was an earthquake in Kaikoura, New Zealand. This is nothing unusual; in fact New Zealand is subject to many earthquakes due to its proximity to a key set of tectonic plate boundaries. My interest in the event piqued partly because I visited this seaside town in 2013 – it’s famous for whale watching and roadside seafood – and partly because the last time New Zealand suffered major earthquake damage (in 2010 and 2011) many insurers were affected significantly.
In practice, most (re)insurance firms licence catastrophe simulation models from companies like AIR and RMS in order to understand their natural catastrophe exposures. For this blog, however, I asked a practical question:
How can an insurer – say one which is providing coverage to the “Harvey Norman” group – understand its potential earthquake exposure without such tools?
In conducting this type of a thought-experiment, I hope to illustrate some powerful features in R that may be of interest to other insurance professionals. Lastly, there’s no reason for choosing Harvey Norman in particular; I just wanted a firm with a household name and therefore locations all over New Zealand. If you’re not a Kiwi, Harvey Norman stores sell electrical goods, a bit like Curry’s in the UK, or MediaMarkt if you’re based in the rest of Europe.
Scrimp and scrape…
The first challenge I faced was finding the location of every Harvey Norman store in New Zealand. Naturally enough they’re listed on their website. However, if you navigate there you’ll see that each location is revealed only if you click on a series of drop down selectors, which makes copying and pasting the info out almost impossible. Next up, I tried to use Excel’s external data web query functionality to interrogate any HTML tables on the page. This approach used to work well in the past but less so these days… Long-story-short, web scraping it was. A number of packages in R can achieve this, but rvest seems to be reasonably popular choice. The following code snippet allowed me to retrieve all of the data:
There are 37 lines of code above; however, the heavy-lifting is achieved in the first 11 lines alone. For completeness, I’ve included a URL in the code comments, which explains how to use the “CSS selector” tool to identify specific parts of a webpage. In so doing I was able to avoid those pesky drop-downs.
The remaining code is used to remove various formatting artifacts; to parse the data; and to apply a second round of formatting where the initial data parse didn’t work for two specific lines. This effort yields the following details:
[1,] "5 Gumdigger Place, Whangarei"
[2,] "63-65 Maki Street, Westgate Lifestyle Centre, Westgate, Auckland"
[3,] "10 Croftfield Lane, Wairau Park, Glenfield, Auckland"
[4,] "20-54 Mt Wellington Highway, Mt Wellington, Auckland"
[5,] "500 Ti Rakau Drive, Botany Downs, Auckland"
Not bad, I’d say. However, more work is needed.
Pinning the tail on the donkey
While addresses are great, if we’re to visualise where each store is, we’ll need to find a way of translating addresses into coordinates …
“Nothing makes the earth seem so spacious as to have friends at a distance; they make the latitudes and longitudes.” —Henry David Thoreau
Clearly Henry was a loner, or perhaps he preferred pen pals. Who knows? Anyway, the following code snippet utilises the XML package to convert the address for each Harvey Norman store location into a format that Google maps is happy with. In return, Google maps returns the required long/lat details:
As before, key wins are gained early on (by line 18 this time). However, on inspecting the intermediate results it is clear that two addresses caused problems for Google maps’ API – e.g. Harvey Norman’s website notes the Dunedin store as being located at “Cnr of Maclaggan & Rattray Street, Dunedin”, whereas Google required, “Cnr of Maclaggan STREET & Rattray Street, Dunedin”. To overcome this, I made two final calls to the Google API but this time I made sure that I provided the format that Google expected. The following results (first five lines shown) are obtained:
Address                                                            long       lat
1 5 Gumdigger Place, Whangarei                                     174.3111 -35.75169
2 63-65 Maki Street, Westgate Lifestyle Centre, Westgate, Auckland 174.6094 -36.81210
3 10 Croftfield Lane, Wairau Park, Glenfield, Auckland             174.7403 -36.77025
4 20-54 Mt Wellington Highway, Mt Wellington, Auckland             174.8451 -36.89847
5 500 Ti Rakau Drive, Botany Downs, Auckland                       174.9145 -36.92816
Shake, rattle and roll
OK, we’ve made good progress on developing an understanding of the exposure profile. Next, we need to build-up a view of the risk profile by downloading historic data on earthquake locations and their magnitudes.
This information is available from GeoNet. As you might expect there is a high volume of data recorded and, rather than providing a single flat file, GeoNet has built a tool that will create a CSV file with data covering the user’s specified location and time range. For this blog post, I elected to focus on the period from 1 Jan 2011 through to 30 Jan 2017, and geographically I was curious about earthquakes near New Zealand’s capital, Wellington. While it is possible to first download the relevant CSVs to a local drive and then sequentially import them into R, I decided to exploit the GeoNet’s URL convention and import the CSV contents directly into R as follows:
The first row of output is transposed and shown below:
[,1]
publicid              "2017p080247"
eventtype             ""
origintime            "2017-01-30T16:36:08.305Z"
modificationtime      "2017-01-30T16:38:58.532Z"
long                  "174.1518"
lat                   "-41.76774"
magnitude             "2.831105"
depth                 "14.84375"
magnitudetype         "M"
depthtype             ""
evaluationmethod      "NonLinLoc"
evaluationstatus      ""
evaluationmode        "automatic"
earthmodel            "nz3drx"
usedphasecount        "44"
usedstationcount      "44"
magnitudestationcount "24"
minimumdistance       "0.0496667"
azimuthalgap          "138.1607"
originerror           "1.529493"
magnitudeuncertainty  "0"
A picture is worth a thousand words
And now we near the end of the current journey. Using the following code, I am able to plot a heat map of historic earthquakes versus Harvey Norman outlets in the Wellington area, as well as either side of the Cook Strait:
This generates the following picture:
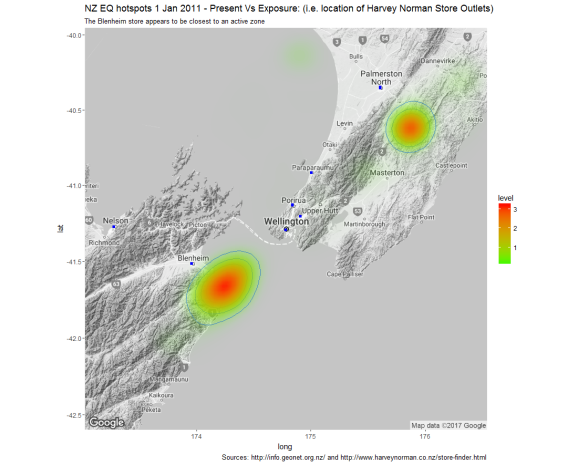
The blue squares on the map represent the location of Harvey Norman stores, while the heatmap element of the chart indicates the riskiest locations based on fitting a 2D Kernel Density estimate to the historic earthquake data.
Clearly, there are a number of potential criticisms of the chart above; however, it is a reasonably powerful way of communicating risks vs exposures quickly. In the second part of this post I aim to discuss some of the shortfalls of the chart above and to outline some details of the sort of conceptual framework needed to close-out some of the gaps.
If you enjoy these posts, or would like to provide some insights – please do leave a comment!
For those interested, the photo in the banner was taken a few years back on the Kepler Track during my trip to New Zealand’s South Island.
R-bloggers.com offers daily e-mail updates about R news and tutorials about learning R and many other topics. Click here if you're looking to post or find an R/data-science job.
Want to share your content on R-bloggers? click here if you have a blog, or here if you don't.