
The use of bicycles in Helsinki
Want to share your content on R-bloggers? click here if you have a blog, or here if you don't.
Every six months, the city of Helsinki publishes data on the number of cyclists in Helsinki per hour. Since 2014, a number of meters have been planted in different areas of Helsinki (Kaisaniemi, Munkkiniemi 1 and 2, Hesperian, Eteläesplanadi and Baana) to count the number of bikes. The latest data is freely available here.
I amalgamated this data set with data on the weather in Helsinki for each day to plot some graphics and create some analysis on the factors that determine the use of bicycles in Helsinki.
1. Data visualization
I found some very good models for the data visualization on Kaggle that I mostly use here.
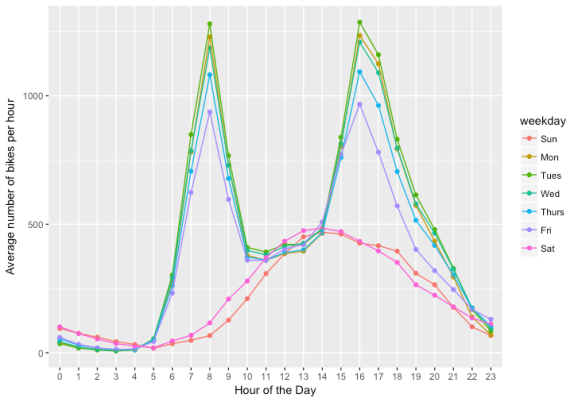
The figure 1 shows the average number of bikes used in Helsinki per hour based on the day. Most of the cyclists seem to use the bike on weekdays to commute. We see two peaks in use, one at 8 in the morning and the second at 4pm.
It is noticeable that the motivation to ride a bike to go to work significantly decreases during the week. Therefore, there is approximatively 40% less bikes used on Friday at 8h than on Tuesday at the same time.
On Saturday and Sunday, people use bicycles in the afternoon but we don’t see the same level of use than on a weekday.

The figure 2 displays the number of bikes per day from 2014 to March 2017 and by temperature. We see a similar trend in the use of bikes in the different years. To no surprise, the maximum number of cyclists per day (more than 20 000 per day) is higher during the summer when the temperatures are high whereas when the temperature is lower than 0, the number of cyclists is usually lower (less than 10 000 a day).

Figure 3 shows the average number of bikes per day by month. The number of bicycles is significant in May 2016 compared to the other years. This might be partly explained by the introduction of a bicycle-sharing system in the city centre of Helsinki in spring 2016. Therefore, it might encourage people living in Helsinki but also tourists to use these bikes.
2. Insights on the factors that determine the use of bicycles
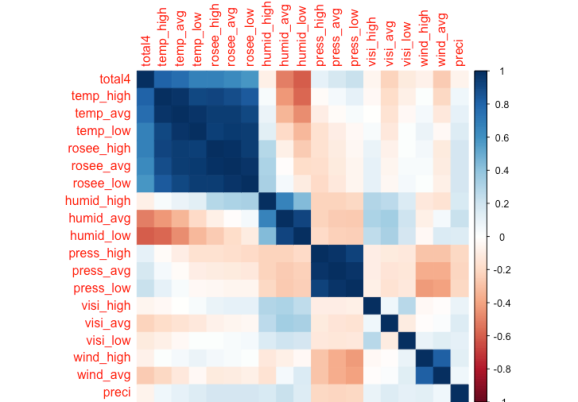
The correlation matrix shows the positive (blue) and negative (red) correlations between the number of bikes used (variable total4) and weather variables such as the temperature (variable temp), the morning dew (variable rosee), the humidity (humid), the atmospheric pressure (press), the visibility (visi), the wind (wind) and the accumulated precipitations (preci) on a day (preci).
The number of cyclists per day is highly and positively correlated with the temperature and the morning dew. In other words, when the temperature is high, people use more bicycles. On the other hand, humidity is highly and negatively correlated with the number of cyclist. The accumulated precipitations and the wind are not significantly correlated.
R-bloggers.com offers daily e-mail updates about R news and tutorials about learning R and many other topics. Click here if you're looking to post or find an R/data-science job.
Want to share your content on R-bloggers? click here if you have a blog, or here if you don't.