
The making of cricket package yorkr – Part 3
Want to share your content on R-bloggers? click here if you have a blog, or here if you don't.
Introduction
This is the 3rd part of my cricket package yorkr in R. In my 2 earlier posts
- The making of cricket package yorkr – Part 1. This post analyzed the performance of team in a ODI match. The batting and bowling performances of the team were analyzed. This post also performed analyses of a country in all matches against another country for e.g. India vs All matches agianst Australia. The best performers with the bat and ball were determined, the best batting partnerships, the performances at different venues etc. The detailed performances of the bowlers of India and Australia in the confrontation were also analyzed.
- The making of cricket package yorkr – Part 2 This post includes all ODI matches between a country and others. For obvious reasons I have chosen India and selected all ODI matches played by India with other countries. This included batting and bowling performances of the country against all oppositions.
As mentioned in my earlier posts the data is taken from Cricsheet
In this post I look at individual performances of batsmen and bowlers in ODIs. For this post I have chosen Virat Kohli & Mahendra Singh Dhoni from India. Kohli has been consistent and in great form right through. Dhoni follows Kohli very closely in ODIs. Dhoni besides his shrewd captaincy is one of the best ODI batsman and a great finisher. I have include AB Devilliers from South Africa who seems to invent new strokes and shots every time, much like Glenn Maxwell.
For bowling analyses I have selected RA Jadeja, Harbhajan Singh *the top Indian ODI bowlers) and Mitchell Johnson who is among the best in the world.
This post is also available at RPubs at yorkr-3. You can also download this post as a pdf from yorkr-3.pdf
My earlier package ‘cricketr’ (see Introducing cricketr: An R package for analyzing performances of cricketers) was based on data from ESPN Cricinfo Statsguru. If you want to take a look at my book with all my articles based on my package cricketr at – Cricket analytics with cricketr!!!. The book is also available in paperback and kindle versions at Amazon which has, by the way, better formatting!
I have added some quick observations on the plots below. However there is a lot more that can be discerned from the plots that I can possibly explain. The charts do display a wealth of insights. Do take a close look at the plots.
library(dplyr)
library(ggplot2)
library(yorkr)
library(reshape2)
library(gridExtra)
library(rpart.plot)
1. Batting Details
The following functions get the overall batting details for a country against all opposition.
a <- getTeamBattingDetails("India",save=TRUE)
b <- getTeamBattingDetails("South Africa",save=TRUE)
2. Get Batsman details
Now I get the details of the batsmen Virat Kohli and Mahendra Singh Dhoni from the saved India file and AB De Villiers from the saved South Africa file
kohli <- getBatsmanDetails(team="India",name="Kohli")
dhoni <- getBatsmanDetails(team="India",name="Dhoni")
devilliers <-  getBatsmanDetails(team="South Africa",name="Villiers")
3. Display the dataframe
the dataframe obtained from the calls above provide detailed information for the batsman in every ODI match. This dataframe has all the fields that can be obtained from ESPN Cricinfo

Performance analyses of batsmen
4. Runs vs deliveries plot
It can be seen from the plots below that Kohli is very consistent in the runs scored. The runs crowd near the regression curve. There is more variance in Dhoni and De Villiers performance. The band on either side of the regression curve represents the 95% confidence interval(A 95% confidence level means that 95% of the intervals would include the population parameter).
p1 <-batsmanRunsVsDeliveries(kohli,"Kohli")
p2 <- batsmanRunsVsDeliveries(dhoni, "Dhoni")
p3 <- batsmanRunsVsDeliveries(devilliers,"De Villiers")
grid.arrange(p1,p2,p3, ncol=3)

5. Total runs vs 4s vs 6s plot
The plots below show the runs (Total runs, Runs from 4s & Runs from sixes) vs the deliveries faced. Kohli scores more runs and more fours which can be evaluated from the slope of the blue and red regression lines (reaches 150+,50+) for Total runs and Runs from fours). De Villers has more Runs from sixes as can be seen the 3rd sub plot (green line)
kohli46 <- select(kohli,batsman,ballsPlayed,fours,sixes,runs)
p1 <- batsmanFoursSixes(kohli46,"Kohli")
dhoni46 <- select(dhoni,batsman,ballsPlayed,fours,sixes,runs)
p2 <- batsmanFoursSixes(dhoni46,"Dhoni")
devilliers46 <- select(devilliers,batsman,ballsPlayed,fours,sixes,runs)
p3 <- batsmanFoursSixes(devilliers46, "De Villiers")
grid.arrange(p1,p2,p3, ncol=3)

6. Batsmen dismissals
Interestingly it can be seen that Dhoni has remained unbeaten more often (47 times) than Kohli or De Villiers. Dhoni despite being a great runner between wickets has been run-out more often.
p1 <-batsmanDismissals(kohli,"Kohli")
p2 <- batsmanDismissals(dhoni, "Dhoni")
p3 <- batsmanDismissals(devilliers, "De Villiers")
grid.arrange(p1,p2,p3, ncol=3)

7. Batsmen Strike Rate
From the plot below Kohli has the best strike rate till 100 runs, the slope seems to steeper. De Villiers seems to do better after 100 runs.
p1 <-batsmanMeanStrikeRate(kohli,"Kohli")
p2 <- batsmanMeanStrikeRate(dhoni, "Dhoni")
p3 <- batsmanMeanStrikeRate(devilliers, "De Villiers")
grid.arrange(p1,p2,p3, ncol=3)

8. Batsmen moving average
Kohli’s and De Villiers’ form can be seen to be improving over the years. Dhoni seems to have hit a slump in recent times. But we have to keep in mind that he has the second highest ODI runs in India and is just behind Kohli
p1 <-batsmanMovingAverage(kohli,"Kohli")
p2 <- batsmanMovingAverage(dhoni, "Dhoni")
p3 <- batsmanMovingAverage(devilliers, "De Villiers")
grid.arrange(p1,p2,p3, ncol=3)

9. Batsmen against opposition
Kohli averages 50 runs against 6 countries, to Dhoni’s 4. Kohli performs well against Australia, New Zealand, West Indies,Pakistan,Bangladesh. Kohli’s performance against England has been mediocre. De Villiers averages around 50 with 5 countries
batsmanRunsAgainstOpposition(kohli,"Kohli")

batsmanRunsAgainstOpposition(dhoni, "Dhoni")

batsmanRunsAgainstOpposition(devilliers, "De Villiers")

10. Batsmen runs at different venues
Kohli’s favorite hunting grounds in ODI are Adelaide, Sydney, Western Australia, Wankhede. Dhoni’s best performances are at Lords, Sydney,Chepauk.
batsmanRunsVenue(kohli,"Kohli")

batsmanRunsVenue(dhoni, "Dhoni")

batsmanRunsVenue(devilliers, "De Villiers")

11. Batsmen runs predict
The plots below predict the number of deliveries needed by each batsmen to score runs shown. For this I have used classification trees based on deliveries and runs using the package rpart. From the plot for Kohli it can be seen that for <26 deliveries Kohli on an average scores 8 runs(7.6), for <58 deliveries scores 30 runs but for >58 deliveries scores around 52 runs. On the other hand De Villiers needs just over 40 deliveries to score 52 runs.
par(mfrow=c(1,3))
par(mar=c(4,4,2,2))
batsmanRunsPredict(kohli,"Kohli")
batsmanRunsPredict(dhoni, "Dhoni")
batsmanRunsPredict(devilliers, "De Villiers")

dev.off()
## null device
##           1
12. Get team bowling details
The function below all the ODI matches between India or Australia and all other countries
c <- getTeamBowlingDetails("India",save=TRUE)
d <- getTeamBowlingDetails("Australia",save=TRUE)
13. Get wicket details
The functions below gets the data frame for each bowler
jadeja <- getBowlerWicketDetails(team="India",name="Jadeja")
harbhajan <- getBowlerWicketDetails(team="India",name="Harbhajan")
ashwin <- getBowlerWicketDetails(team="India",name="Ashwin")
johnson <-  getBowlerWicketDetails(team="Australia",name="Johnson")
14. Display data frame
The details of the data frame is shown below
knitr::kable(head(jadeja))
| bowler | overs | maidens | runs | wickets | economyRate | date | opposition | venue |
|---|---|---|---|---|---|---|---|---|
| RA Jadeja | 6 | 0 | 40 | 0 | 6.67 | 2009-02-08 | Sri Lanka | R Premadasa Stadium |
| RA Jadeja | 7 | 1 | 34 | 0 | 4.86 | 2009-06-26 | West Indies | Sabina Park, Kingston |
| RA Jadeja | 2 | 0 | 12 | 0 | 6.00 | 2009-06-28 | West Indies | Sabina Park, Kingston |
| RA Jadeja | 9 | 0 | 39 | 1 | 4.33 | 2009-10-25 | Australia | Reliance Stadium |
| RA Jadeja | 7 | 1 | 35 | 4 | 5.00 | 2009-10-28 | Australia | Vidarbha Cricket Association Stadium, Jamtha |
| RA Jadeja | 7 | 1 | 35 | 4 | 5.00 | 2009-10-28 | Australia | Vidarbha Cricket Association Stadium, Jamtha |
15. Bowler Economy rate
Harbhajan and Ashwin have a better economy rate than RA Jadeja
p1 <- bowlerEconomyRate(jadeja,"RA Jadeja")
p2<-bowlerEconomyRate(harbhajan, "Harbhajan")
p3<-bowlerEconomyRate(ashwin, "Ashwin")
p4<-bowlerEconomyRate(johnson, "MG Johnson")
grid.arrange(p1,p2,p3,p4, ncol=2)

15. Mean runs conceded by bowler
p1<-bowlerMeanRuns(jadeja,"RA Jadeja")
p2<-bowlerMeanRuns(harbhajan, "Harbhajan")
p3<-bowlerMeanRuns(ashwin, "Ashwin")
p4<-bowlerMeanRuns(johnson, "MG Johnson")
grid.arrange(p1,p2,p3,p4, ncol=2)

15. Moving average of bowler
From the plots below MG Johnson, Harbhajan and Ashwin have been performing very consistently. RA Jadeja bowling seems to be taking a nosedive, though he is at the top of all ODI bowlers of India
p1<-bowlerMovingAverage(jadeja,"RA Jadeja")
p2<-bowlerMovingAverage(harbhajan, "Harbhajan")
p3<-bowlerMovingAverage(ashwin, "Ashwin")
p4<-bowlerMovingAverage(johnson, "MG Johnson")
grid.arrange(p1,p2,p3,p4, ncol=2)

16. Wicket average
Jadeja has a better wicket average than Harbhajan and Ashwin.Jadeja and Ashwin average around 2 wickets Harbhajan averages 1.5 wickets(tendency to 2)
p1<-bowlerWicketPlot(jadeja,"RA Jadeja")
p2<-bowlerWicketPlot(harbhajan, "Harbhajan")
p3<-bowlerWicketPlot(ashwin, "Ashwin")
p4<-bowlerWicketPlot(johnson, "MG Johnson")
grid.arrange(p1,p2,p3,p4, ncol=2)

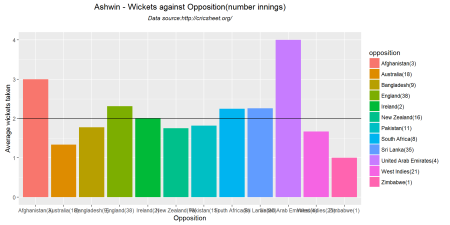
16. Wickets opposition
Jadeja’s best performances have been against England, Pakistan, New Zealand and Zimbabwe. For Harbhajan it has been New Zealand, Sri Lanka and Zimbabwe.
bowlerWicketsAgainstOpposition(jadeja,"RA Jadeja")

bowlerWicketsAgainstOpposition(harbhajan, "Harbhajan")

bowlerWicketsAgainstOpposition(ashwin, "Ashwin")
bowlerWicketsAgainstOpposition(johnson, "MG Johnson")

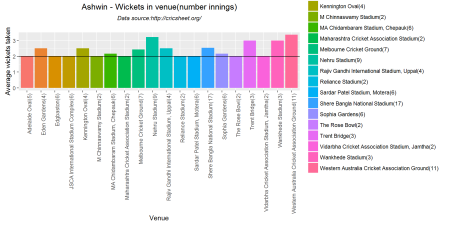
16. Wickets venue
The top 20 venues for each bowler is shown in the plots
bowlerWicketsVenue(jadeja,"RA Jadeja")

bowlerWicketsVenue(harbhajan, "Harbhajan")

bowlerWicketsVenue(ashwin, "Ashwin")
bowlerWicketsVenue(johnson, "MG Johnson")

16. Create a data frame with wickets and deliveries
jadeja1 <- getDeliveryWickets(team="India",name="Jadeja",save=FALSE)
harbhajan1 <- getDeliveryWickets(team="India",name="Harbhajan",save=FALSE)
ashwin1 <- getDeliveryWickets(team="India",name="Ashwin",save=FALSE)
johnson1 <- getDeliveryWickets(team="Australia",name="MG Johnson",save=FALSE)
17. Deliveries to wickets plots
The following plots try to predict the average number of deliveries required for the wickets taken. As in the batsman runs predict I have used classification trees between deliverie at which a wicket was taken. The package rpart was used for the classification. The internediate nodes are the number of deliveries and the leaf nodes are the wickets taken. Though the wickets are in decimal we can intepret the tree as follows For RA Jadeja <22 deliveries result in 1.2 (~1 wicket) and >22 to take 1.6 wicket (~2 wickets). Interestingly Harbhajan needs <9.5 deliveries to take a wicket. Harbhajan is more likely to provide a quicker breakthrough.
par(mfrow=c(1,2))
par(mar=c(4,4,2,2))
bowlerWktsPredict(jadeja1,"RA Jadeja")
bowlerWktsPredict(harbhajan1,"Harbhajan Sigh")

dev.off()
## null device
##           1
Similarly MG Johnson can provide a breakthrough with just around 14 deliveries
par(mfrow=c(1,2))
par(mar=c(4,4,2,2))
bowlerWktsPredict(ashwin1,"Ravichander Ashwin")
bowlerWktsPredict(johnson1,"MG Johnson")

dev.off()
## null device
##           1
Conclusion
ODI batsman
- The top 2 ODI Indian batsman(Kohli and Dhoni) and De Villiers of South Africa were considered.
- Kohli has a better strike rate till about 100 runs(steeper slope) and De Villiers beyond 100.
- Dhoni has remained unbeaten more number of times than the other 2. It may have been possible that his average would have been higher if he had come in earlier
- Kohli and De Villiers have performed consistently. Dhoni needs to get back his touch
ODI bowlers
- RA Jadeja has a better wicket taking rate than Harbhajan and Ashwin.
- Ashwin and Harbhajan have a better economy rate than Jadeja
- Harbhjanan, Ashwin and MG Johnson have performed consistently while RA Jadeja’s performance has been on the decline.
- Harbhajan and MG Johnson need around 11 balls to make a break through
This was probably the last set of functions for my cricket package yorkr. Over the next several weeks I will be cleaning up, documenting, refining the functions and removing any glitches. I hope to have the package released in the next 6-8 weeks
Also see
You may also like
- What’s up Watson? Using IBM Watson’s QAAPI with Bluemix, NodeExpress
- The common alphabet of programming languages
- A method to crowd source pothole marking on (Indian) roads
- The Anomaly
- Simulating the domino effect in Android using Box2D and AndEngine
- Presentation on Wireless Technologies – Part 1
- Natural selection of database technology through the years

R-bloggers.com offers daily e-mail updates about R news and tutorials about learning R and many other topics. Click here if you're looking to post or find an R/data-science job.
Want to share your content on R-bloggers? click here if you have a blog, or here if you don't.