
Ridge regression in R exercises
Want to share your content on R-bloggers? click here if you have a blog, or here if you don't.
Bias vs Variance tradeoff is always encountered in applying supervised learning algorithms. Least squares regression provides a good fit for the training set but can suffer from high variance which lowers predictive ability. To counter this problem, we can regularize the beta coefficients by employing a penalization term. Ridge regression applies l2 penalty to the residual sum of squares. In contrast, LASSO regression, which was covered here previously, applies l1 penalty.
Using ridge regression, we can shrink the beta coefficients towards zero which would reduce variance at the cost of higher bias which can result in better predictive ability than least squares regression. In this exercise set we will use the glmnet package (package description: here) to implement ridge regression in R.
Answers to the exercises are available here.
Exercise 1
Load the lars package and the diabetes dataset (Efron, Hastie, Johnstone and Tibshirani (2003) “Least Angle Regression” (with discussion) Annals of Statistics). This is the same dataset from the LASSO exercise set and has patient level data on the progression of diabetes. Next, load the glmnet package that will that we will now use to implement ridge regression.
The dataset has three matrices x, x2 and y. x has a smaller set of independent variables while x2 contains the full set with quadratic and interaction terms. y is the dependent variable which is a quantitative measure of the progression of diabetes.
Generate separate scatterplots with the line of best fit for all the predictors in x with y on the vertical axis.
Regress y on the predictors in x using OLS. We will use this result as benchmark for comparison.
Exercise 2
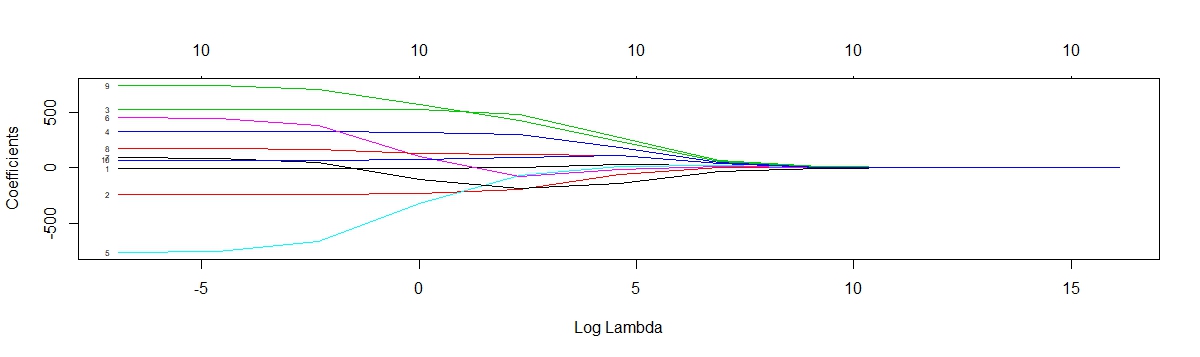
Fit the ridge regression model using the glmnet function and plot the trace of the estimated coefficients against lambdas. Note that coefficients are shrunk closer to zero for higher values of lambda.
Exercise 3
Use the cv.glmnet function to get the cross validation curve and the value of lambda that minimizes the mean cross validation error.
Exercise 4
Using the minimum value of lambda from the previous exercise, get the estimated beta matrix. Note that coefficients are lower than least squares estimates.
Exercise 5
To get a more parsimonious model we can use a higher value of lambda that is within one standard error of the minimum. Use this value of lambda to get the beta coefficients. Note the shrinkage effect on the estimates.
- Avoid model over-fitting using cross-validation for optimal parameter selection
- Explore maximum margin methods such as best penalty of error term support vector machines with linear and non-linear kernels.
- And much more
Exercise 6
Split the data randomly between a training set (80%) and test set (20%). We will use these to get the prediction standard error for least squares and ridge regression models.
Exercise 7
Fit the ridge regression model on the training and get the estimated beta coefficients for both the minimum lambda and the higher lambda within 1-standard error of the minimum.
Exercise 8
Get predictions from the ridge regression model for the test set and calculate the prediction standard error. Do this for both the minimum lambda and the higher lambda within 1-standard error of the minimum.
Exercise 9
Fit the least squares model on the training set.
Exercise 10
Get predictions from the least squares model for the test set and calculate the prediction standard error.
R-bloggers.com offers daily e-mail updates about R news and tutorials about learning R and many other topics. Click here if you're looking to post or find an R/data-science job.
Want to share your content on R-bloggers? click here if you have a blog, or here if you don't.