
Data Science Jobs Report 2019: Python Way Up, Tensorflow Growing Rapidly, R Use Double SAS
Want to share your content on R-bloggers? click here if you have a blog, or here if you don't.
In my ongoing quest to track The Popularity of Data Science Software, I’ve just updated my analysis of the job market. To save you from reading the entire tome, I’m reproducing that section here.
Job Advertisements
One of the best ways to measure the popularity or market share of software for data science is to count the number of job advertisements that highlight knowledge of each as a requirement. Job ads are rich in information and are backed by money, so they are perhaps the best measure of how popular each software is now. Plots of change in job demand give us a good idea of what is likely to become more popular in the future.
Indeed.com is the biggest job site in the U.S., making its collection of job ads the best around. As their co-founder and former CEO Paul Forster stated, Indeed.com includes “all the jobs from over 1,000 unique sources, comprising the major job boards – Monster, CareerBuilder, HotJobs, Craigslist – as well as hundreds of newspapers, associations, and company websites.” Indeed.com also has superb search capabilities. It used to have a job trend plotter, but that tool has apparently been shut down.
Searching for jobs using Indeed.com is easy, but searching for software in a way that ensures fair comparisons across packages is challenging. Some software is used only for data science (e.g. SPSS, Apache Spark) while others are used in data science jobs and more broadly in report-writing jobs (e.g. SAS, Tableau). General-purpose languages (e.g. Python, C, Java) are heavily used in data science jobs, but the vast majority of jobs that use them have nothing to do with data science. To level the playing field, I developed a protocol to focus the search for each software within only jobs for data scientists. The details of this protocol are described in a separate article, How to Search for Data Science Jobs. All of the graphs in this section use those procedures to make the required queries.
I collected the job counts discussed in this section on May 27, 2019 and February 24, 2017. One might think that a sample of on a single day might not be very stable, but the large number of job sources makes the counts in Indeed.com’s collection of jobs quite consistent. Data collected in 2017 and 2014 using the same protocol correlated r=.94, p=.002.
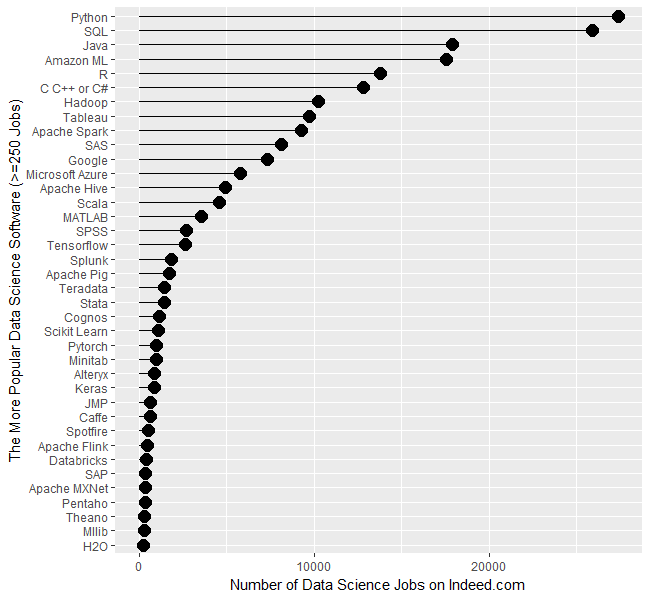
Figure 1a shows that Python is in the lead with 27,374 jobs, followed by SQL with 25,877. Java and Amazon’s Machine Learning (ML) tools are roughly 25% further below, with jobs in the 17,000s. R and the C variants come next with around 13,000. People frequently compare R and Python, but when it comes to getting a data science job, there are only half as many for R as for Python. That doesn’t mean they’re the same sort of job, of course. I still see more statisticians using R and machine learning people preferring Python, but Python is definitely on a roll! From Hadoop on down, there is a slow decline in jobs. R is also frequently compared to SAS, which has only 8,123 compared to R’s 13,800.
The scale of Figure 1a is so wide that the bottom package, H20 appears to be zero, when in fact there are 257 jobs for it.
To let us compare the less popular software, I plotted them separately in Figure 1b. Mathematica and Julia are the leaders of this set, with around 219 jobs each. The ancient FORTRAN language is still hanging on to life with 195 jobs. The open source WEKA software and IBM’s Watson are next, with around 185 each. From XGBOOST on down, there is a fairly steady slow decline.
There are several tools that use a workflow interface: Enterprise Miner, KNIME, RapidMiner, and SPSS Modeler. They’re all around the same area between 50 and 100 jobs. In many of the other measures of popularity, RapidMiner beats the very similar KNIME tool, but here there are 50% more jobs for the latter. Alteryx is also a workflow-based tool, however, it has pulled away from the pack, appearing back on Figure 1a with 901 jobs.

When interpreting the scale on Figure 1b, what looks like zero is indeed zero. From Systat on down, none of the packages have more than 10 job listings.
It’s important to note that the values shown in Figures 1a and 1b are single points in time. The number of jobs for the more popular software do not change much from day to day. Therefore, the relative rankings of the software shown in Figure 1a is unlikely to change much over the coming year or two. The less popular packages shown in Figure 1b have such low job counts that their ranking is more likely to shift from month to month, though their position relative to the major packages should remain more stable.
Next, let’s look at the change in jobs from the 2017 data to now (2019). Figure 1c shows the percent change for those packages that had at least 100 job listings back in 2017. Without such a limitation, software that goes from 1 job in 2017 to 5 jobs in 2019 would have a 500% increase, but still would be of little interest. Software whose job market is heating up, or growing, is shown in red, while those that are cooling down are shown in blue.

Tensorflow, the deep learning software from Google, is the fastest growing at 523%. Next is Apache Flink, a tool that analyzes streaming data, at 289%. H2O is next, with 150% growth. Caffe is another deep learning framework and its 123% growth reflects the popularity of artificial intelligence algorithms.
Python shows “only” 97% growth, but its popularity was already so high that the 13,471 jobs that it added surpasses the total jobs of many of the other packages!
Tableau is showing a similar rate of growth, though it was a comparably small number of additional jobs, at 4,784.
From the Julia language on down, we see a slowing decrease in growth. I’m surprised to see that jobs for SAS and SPSS are still growing, though barely at 6% and 1%, respectively.
If you enjoyed reading this article, you might be interested in my recent series of reviews on point-and-click front-ends for the R language. I invite you to subscribe to this blog, or follow me on Twitter.
R-bloggers.com offers daily e-mail updates about R news and tutorials about learning R and many other topics. Click here if you're looking to post or find an R/data-science job.
Want to share your content on R-bloggers? click here if you have a blog, or here if you don't.