
Anaerobic Stress in Seeds – A Chemical Similarity Network Story
Want to share your content on R-bloggers? click here if you have a blog, or here if you don't.
The chemical similarity network or CSN is a great tool for organizing biological data based on known biochemistry or chemical structural similarity. Here is an example CSN for visualizing metabolomic changes (measured via GC/TOF) due to anaerobic stress in germinating seeds.
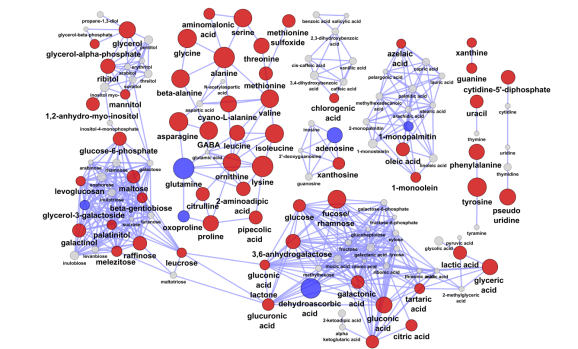
In this network edges are formed for chemical similarity scores > 75. Node color describes significant (adjusted p-value < 0.05, q-value = 0.05, paired t-Test) increase (red), decrease (blue) or no change (gray) in anaerobic relative to aerobic treatments. Node size is inversely proportional to the tests p-value.
This CSN was not hard to construct and minimally requires knowledge of analyte PubChem chemical identifiers (CIDs). CIDs can be used to calculate the chemical similarity matrix using online tools provided by PubChem. This symmetric matrix can be easily formatted to create an edge list containing the basic information: source, target and similarity score.
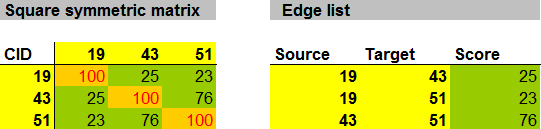
Here is a function for converting square symmetric matrices to edge lists using the R statistical programming environment.
mat.to.edge.list<-function(mat)
{

#accessory function
all.pairs<-function(r,type="one")
   {
    switch(type,
    one = list(first = rep(1:r,rep(r,r))[lower.tri(diag(r))],
    second = rep(1:r, r)[lower.tri(diag(r))]),
    two = list(first = rep(1:r, r)[lower.tri(diag(r))],
    second = rep(1:r,rep(r,r))[lower.tri(diag(r))]))
 ids<-all.pairs(ncol(mat))
 tmp<-as.data.frame(do.call("rbind",lapply(1:length(ids$first) ,function(i)
  {
   value<-mat[ids$first[i],ids$second[i]]
   name<-c(colnames(mat)[ids$first[i]],colnames(mat)[ids$secon   d[i]])
   c(name,value)
  })))
 colnames(tmp)<-c("source","target","value")
 return(tmp)
 }
The function mat.to.edge.list will convert a square symmetric matrix to an edge list through the extraction of the upper triangle excluding the diagonal or self edges.
This edge list can now be visualized as a CSN using some software (see brief instructions here). I prefer to use Cytoscape for this. The edge list merely contains instructions for which vertices or nodes representing metabolites should be connected.
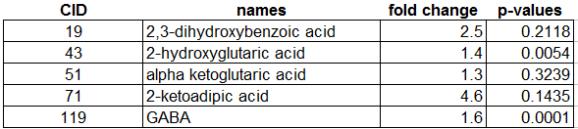
An additional node annotation or attribute table can also be imported into Cytoscape and used to alter the node properties based on statistical results.
R-bloggers.com offers daily e-mail updates about R news and tutorials about learning R and many other topics. Click here if you're looking to post or find an R/data-science job.
Want to share your content on R-bloggers? click here if you have a blog, or here if you don't.